
Category: Linux/Unix
-

Is 2026 the Year of Desktop Linux? Unpacking the Latest Developments
For as long as I’ve been in tech, the phrase “The Year of Desktop Linux” has been bandied about more often than I care to count. Yet, as we move into 2026, something feels different. The Linux desktop landscape is seeing a burst of new energy: innovative distributions, maturing desktop environments, hardware vendors giving us…
-
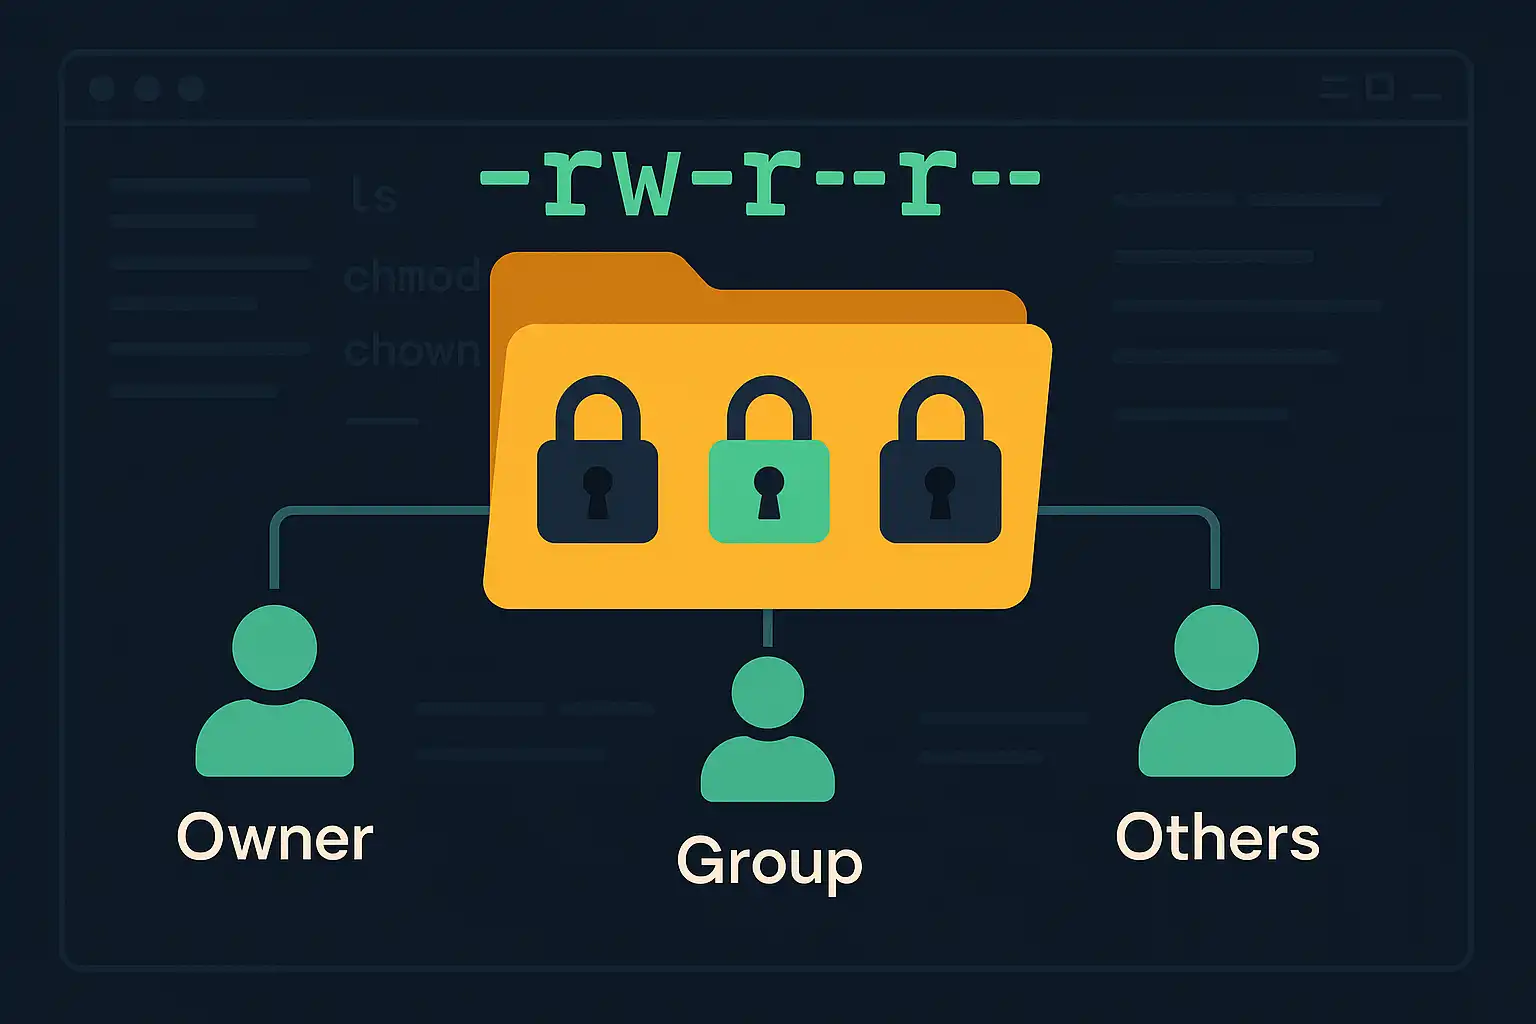
Understanding File and Directory Permissions in Linux
File and directory permissions are fundamental to maintaining a secure and organized Linux environment. Correctly setting permissions helps protect data and ensures that only authorized users access or modify specific files. In this article, we’ll explore the basics of file and directory permissions, how users and groups work, and introduce essential commands like ls, chmod,…
-

Supercharging Linux Development with AI Coding Agents
Over the past year, AI coding agents have become essential companions for developers looking to streamline their workflow, boost productivity, and minimize errors—especially in Linux environments. As someone experienced in integrating these agents into various stages of the software development lifecycle, I’m excited to share how they’re specifically transforming day-to-day Linux development. Why Linux? Linux…
-
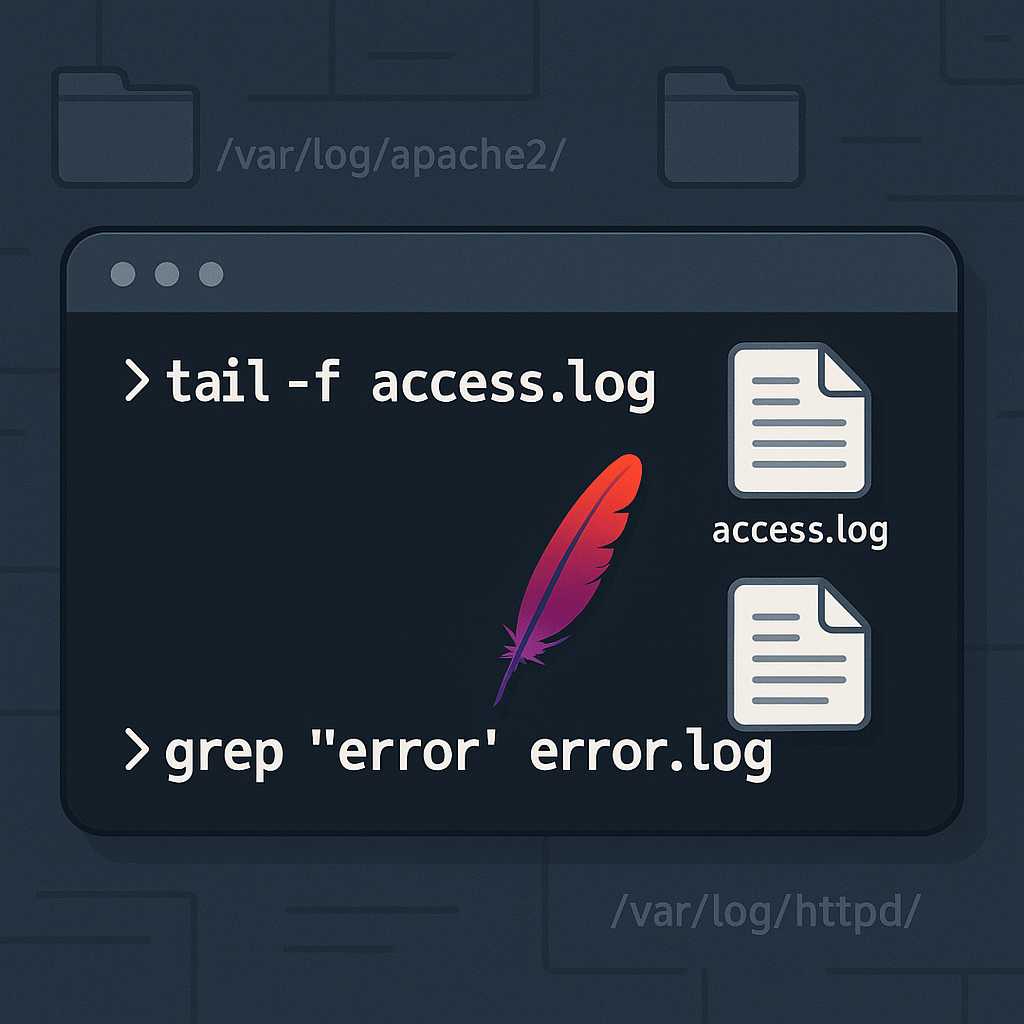
Managing Apache Service Logs from the Command Line
If you’re running web services on a Linux server, monitoring Apache’s logs is essential for troubleshooting and performance tuning. Apache, by default, generates two primary log files: the access log and the error log. In this article, I’ll show you my favorite command-line ways to view, tail, search, and archive Apache logs, all from your…
-
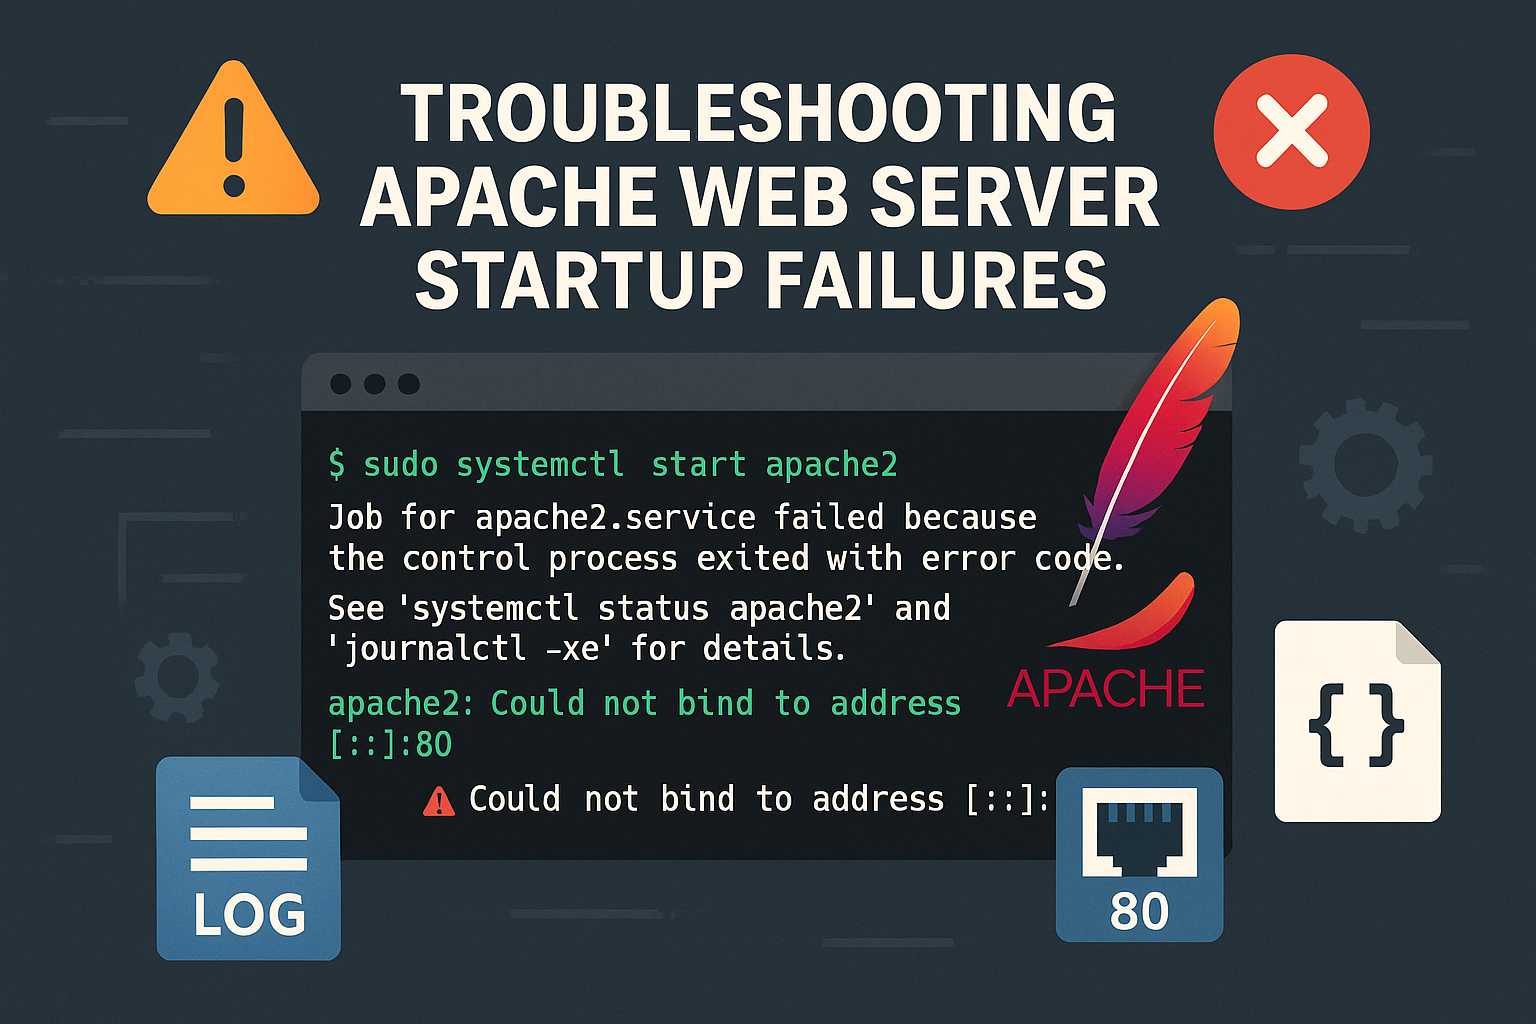
Troubleshooting Apache Startup Failures from the Command Line
When you’re running a Linux server hosting web sites with Apache, seeing the dreaded “Failed to start Apache” error can be nerve-wracking, especially if you’re unsure where to begin troubleshooting. In this article, I’ll walk through a systematic way to debug and resolve Apache startup issues using only the command line. 1. Check the Status…
-
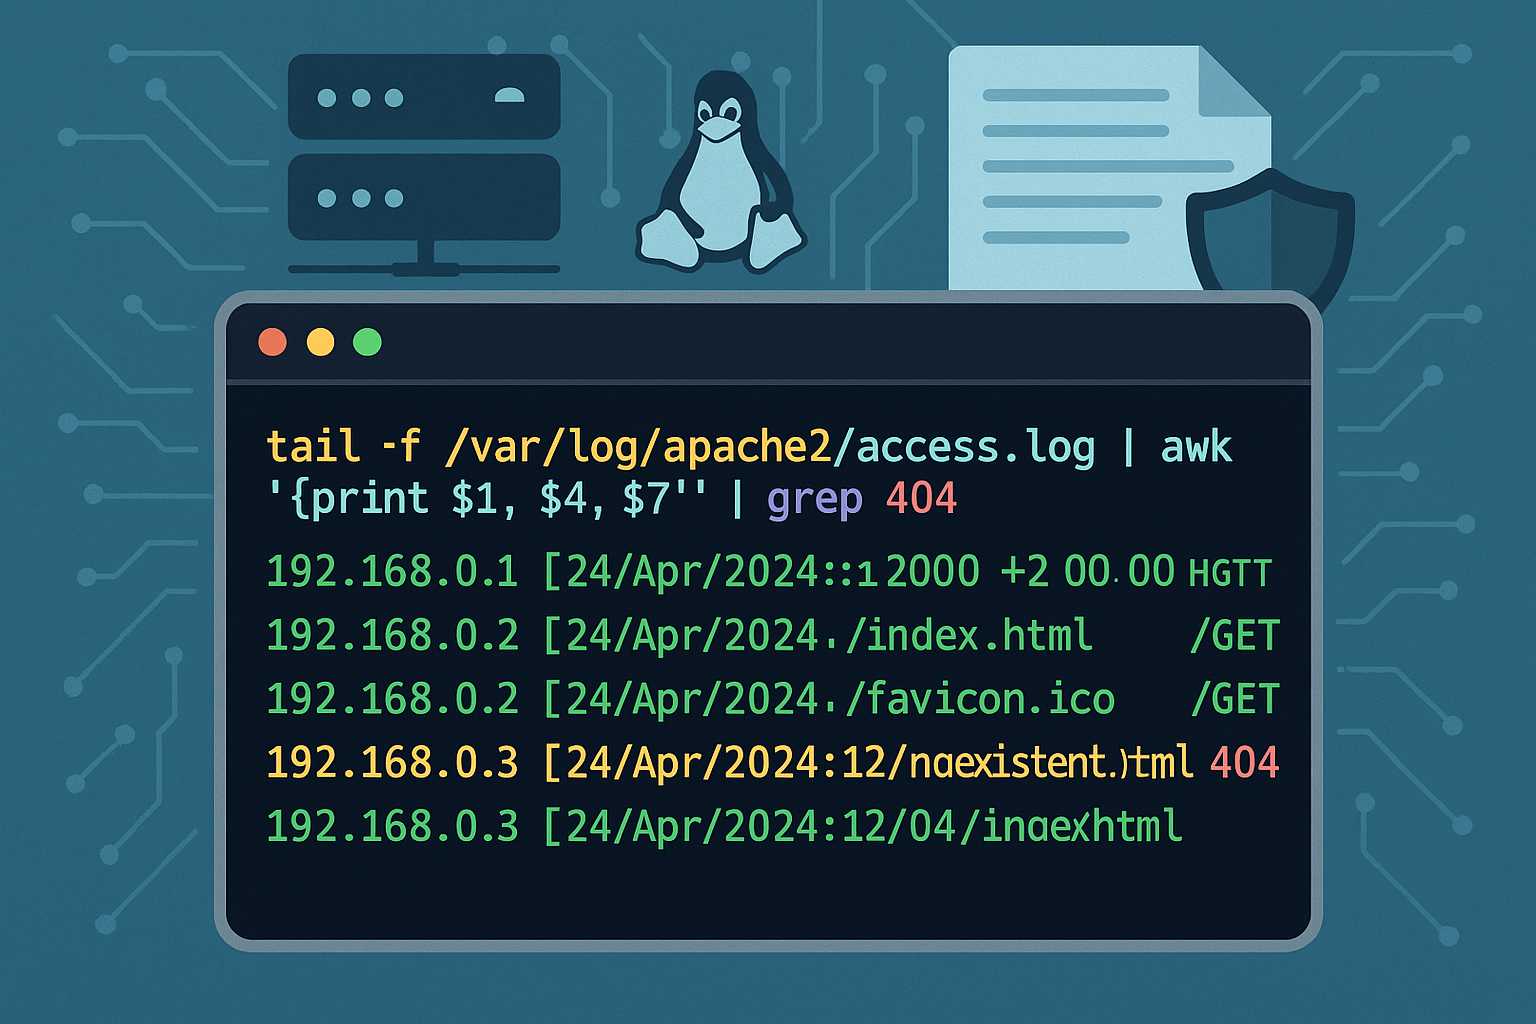
Understanding Apache’s Access Log: Command-Line Tips for Monitoring Traffic
When running an Apache web server, one of your most important tools for monitoring and troubleshooting is the access log. The Apache access log provides a granular record of every client request your web server handles, including the request method, path, HTTP status code, user agent, and more. In this article, I’ll show you how…
-
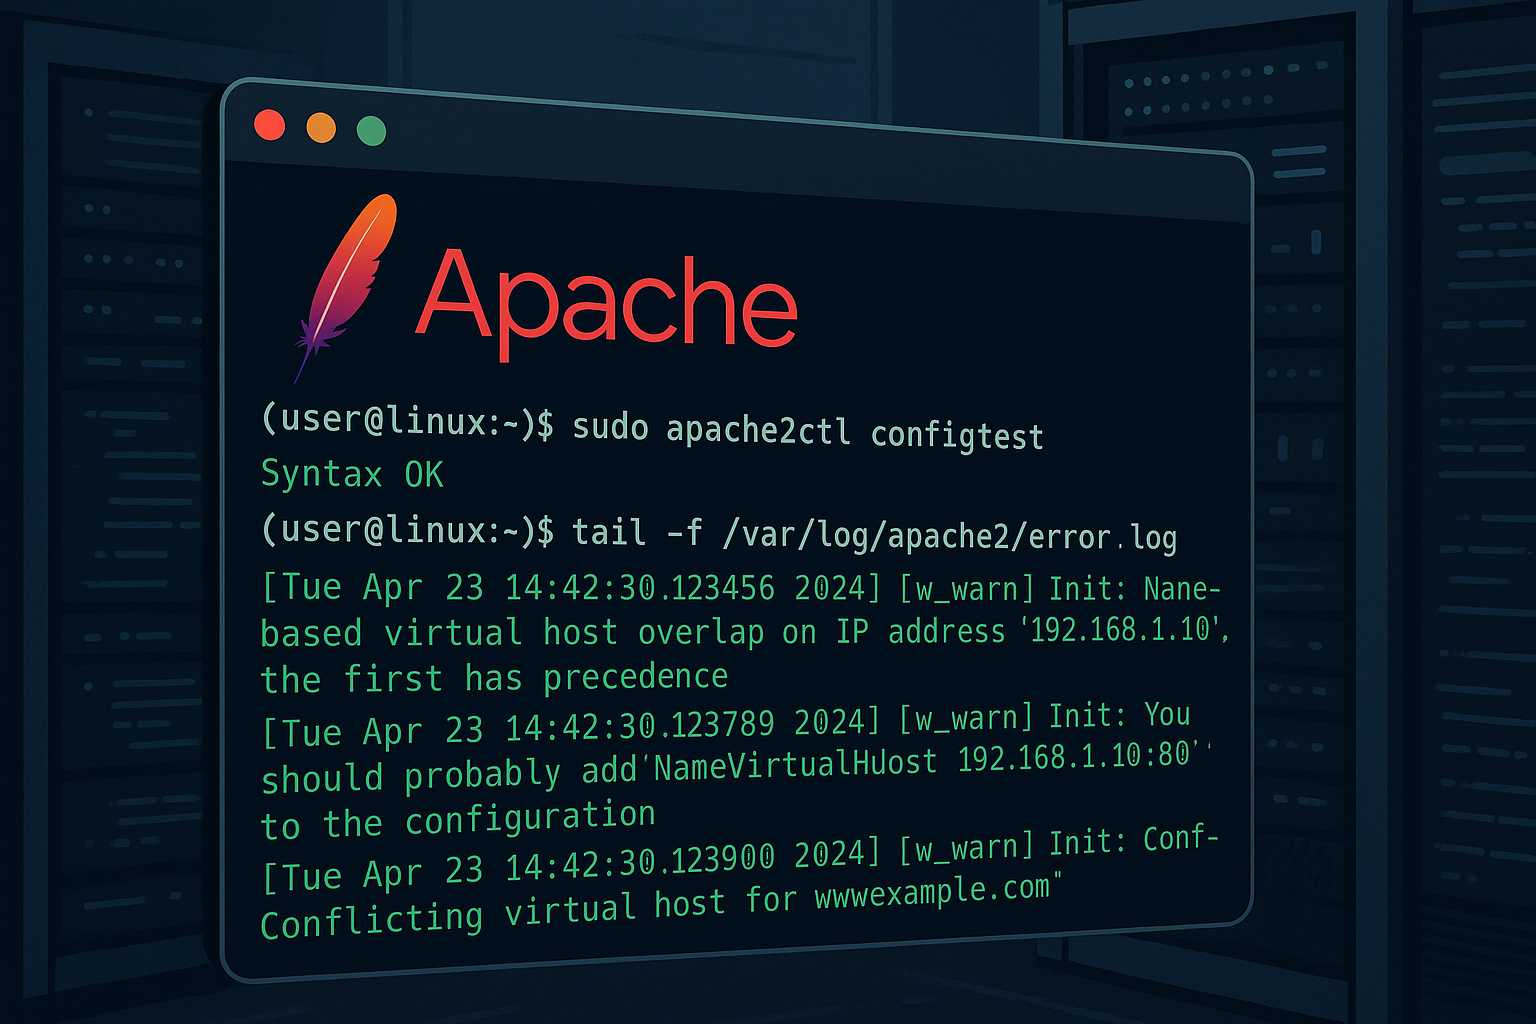
Debugging Apache Virtual Host Issues from the Command Line
Running into problems with Apache virtual hosts? As someone who manages Linux servers primarily via the command line, I often see even seasoned admins get stuck with subtle configuration issues. This article walks you through a practical, command-line-first approach to debugging Apache virtual host problems for any flavor of Linux web server. 1. Verify Virtual…
-
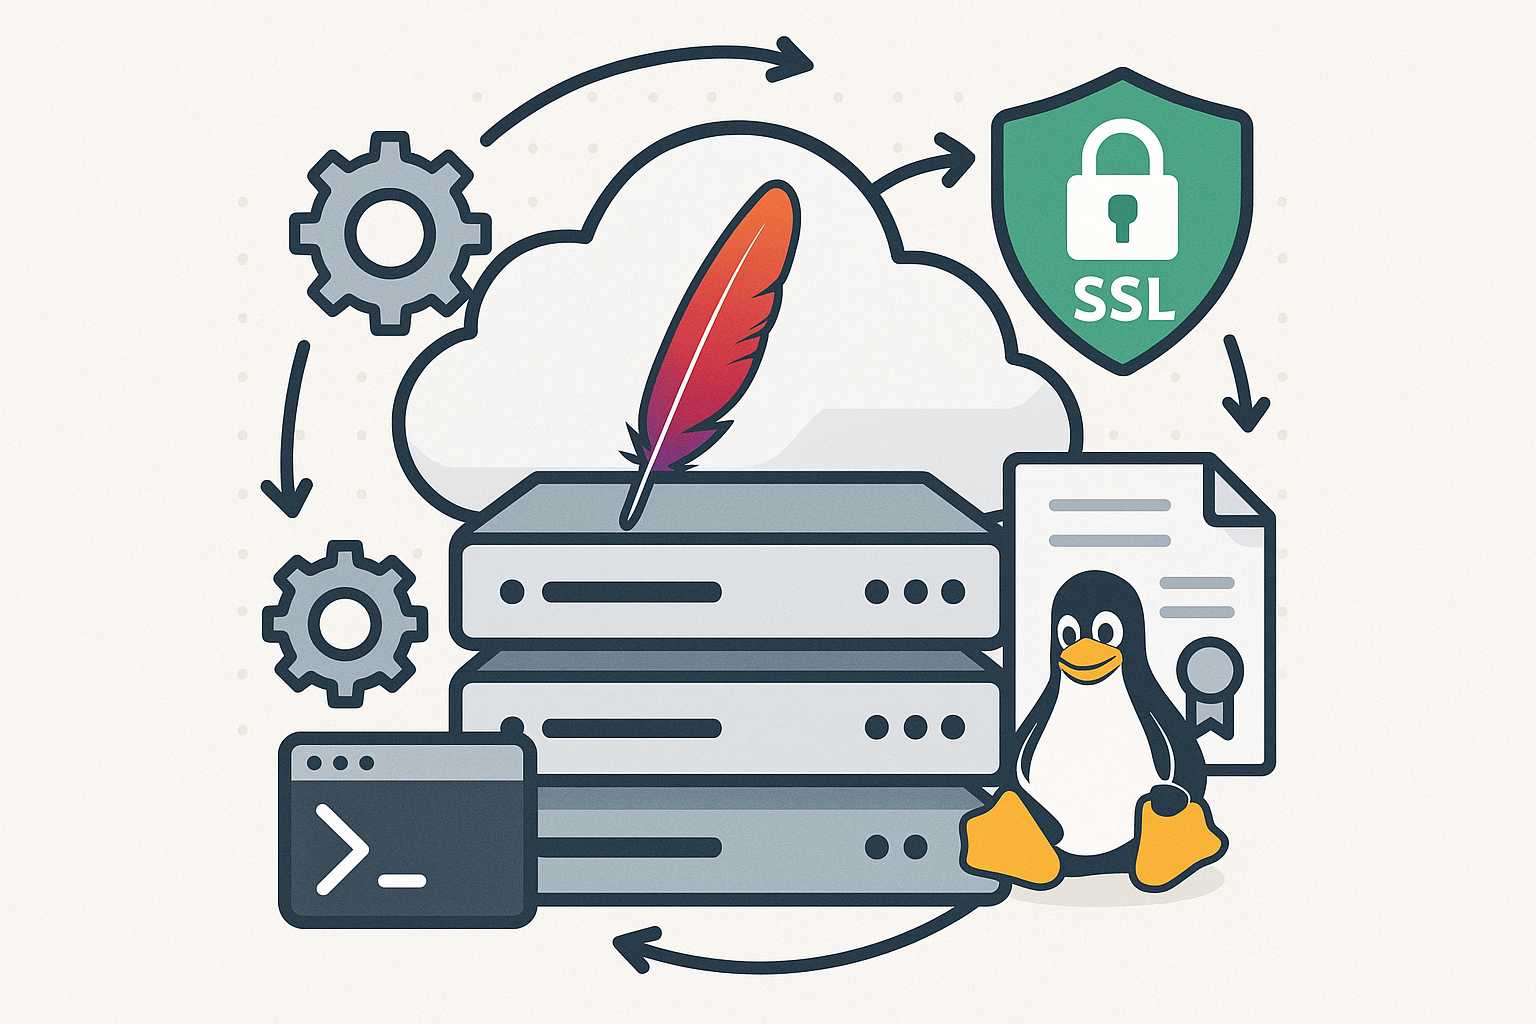
Automating SSL Certificate Renewal for Apache on Linux Servers
Ensuring your websites remain secure with a valid SSL certificate is essential for modern web hosting. However, manually renewing and installing SSL certificates can become a tedious and error-prone process, especially if you manage multiple Apache servers. Luckily, with the right command-line tools and a little automation, you can set up seamless renewals and installations,…
-
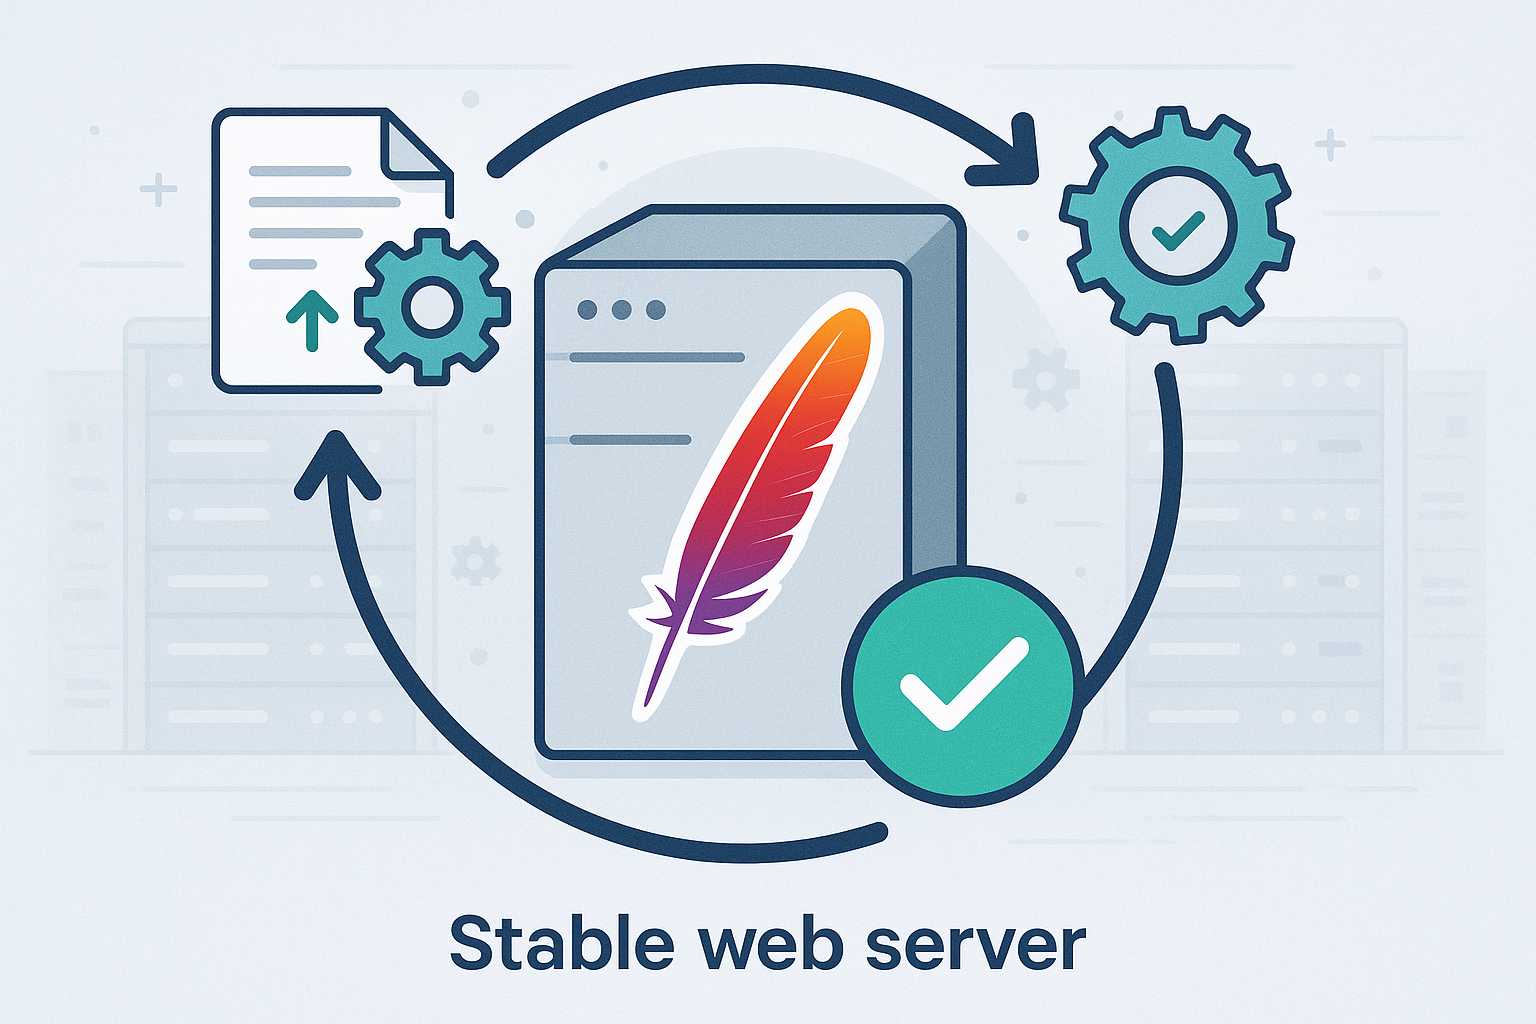
How to Gracefully Reload Apache Configuration Without Downtime
When administering Apache web servers, it’s common to tweak configuration files to update virtual hosts, enable new modules, or adjust security policies. However, applying these changes can be nerve-wracking if you’re worried about interrupting service for your users. Fortunately, Apache provides several ways to reload configuration without causing downtime. In this article, I’ll walk you…
-
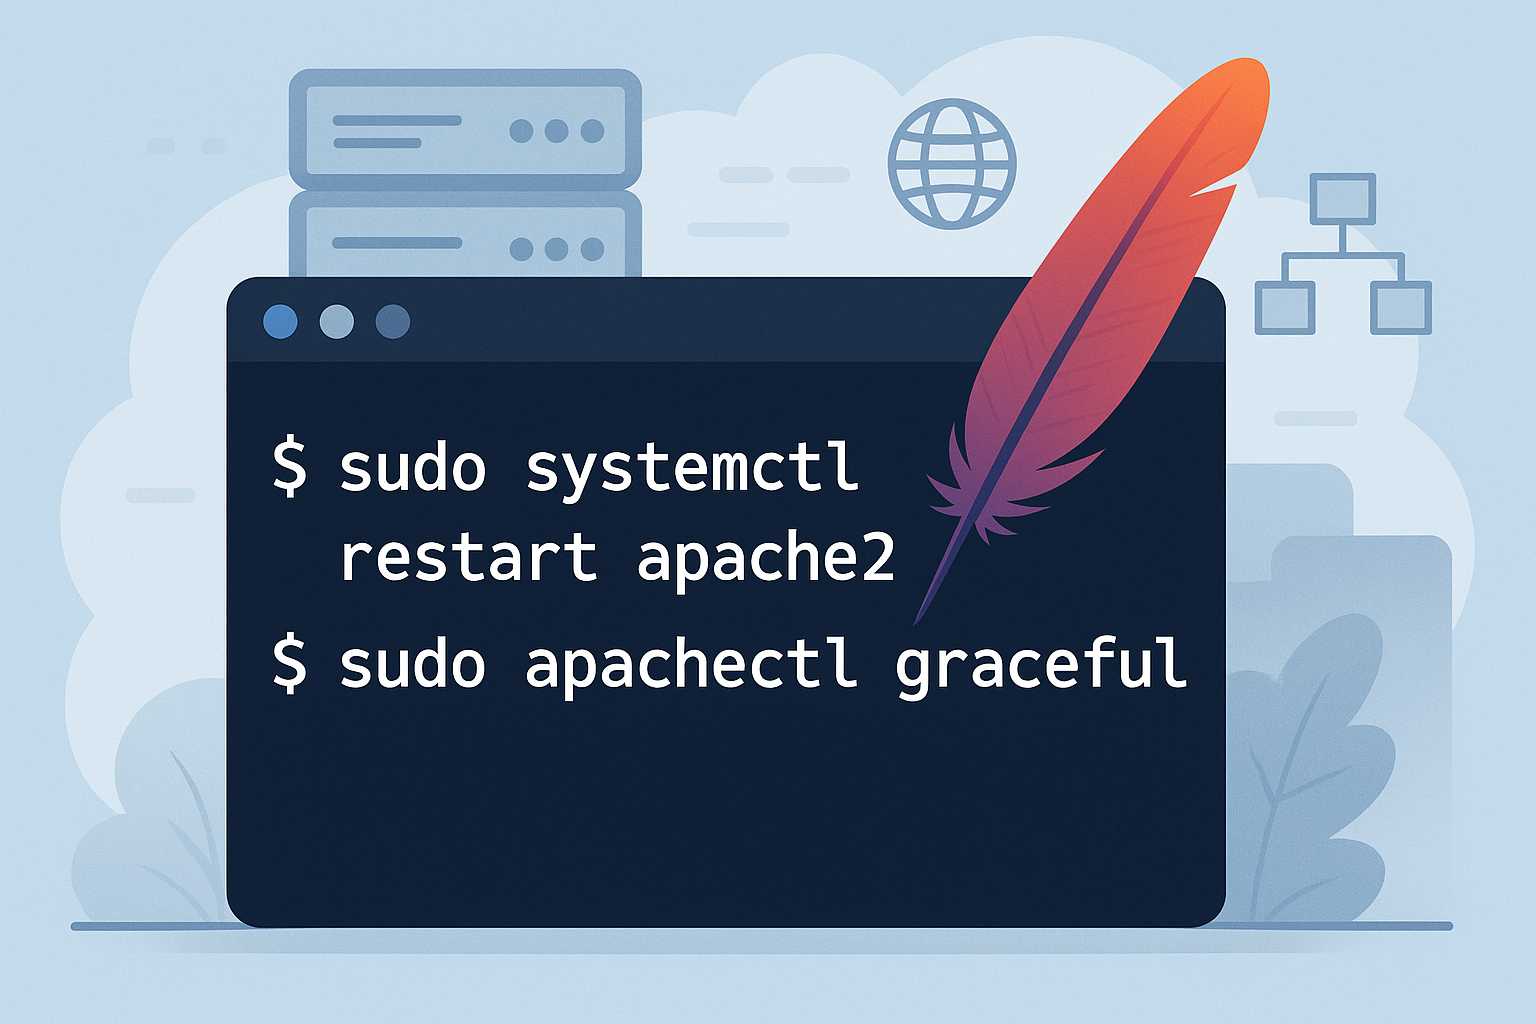
How to Restart Apache Safely from the Command Line
Restarting the Apache web server is a common but critical task for Linux administrators. Whether you’re rolling out a configuration change, adding an SSL certificate, or troubleshooting issues, doing this properly ensures you avoid unnecessary downtime or lost connections. In this article, I’ll walk you through the safest and most effective ways to restart Apache…