
Tag: Best Practices
-
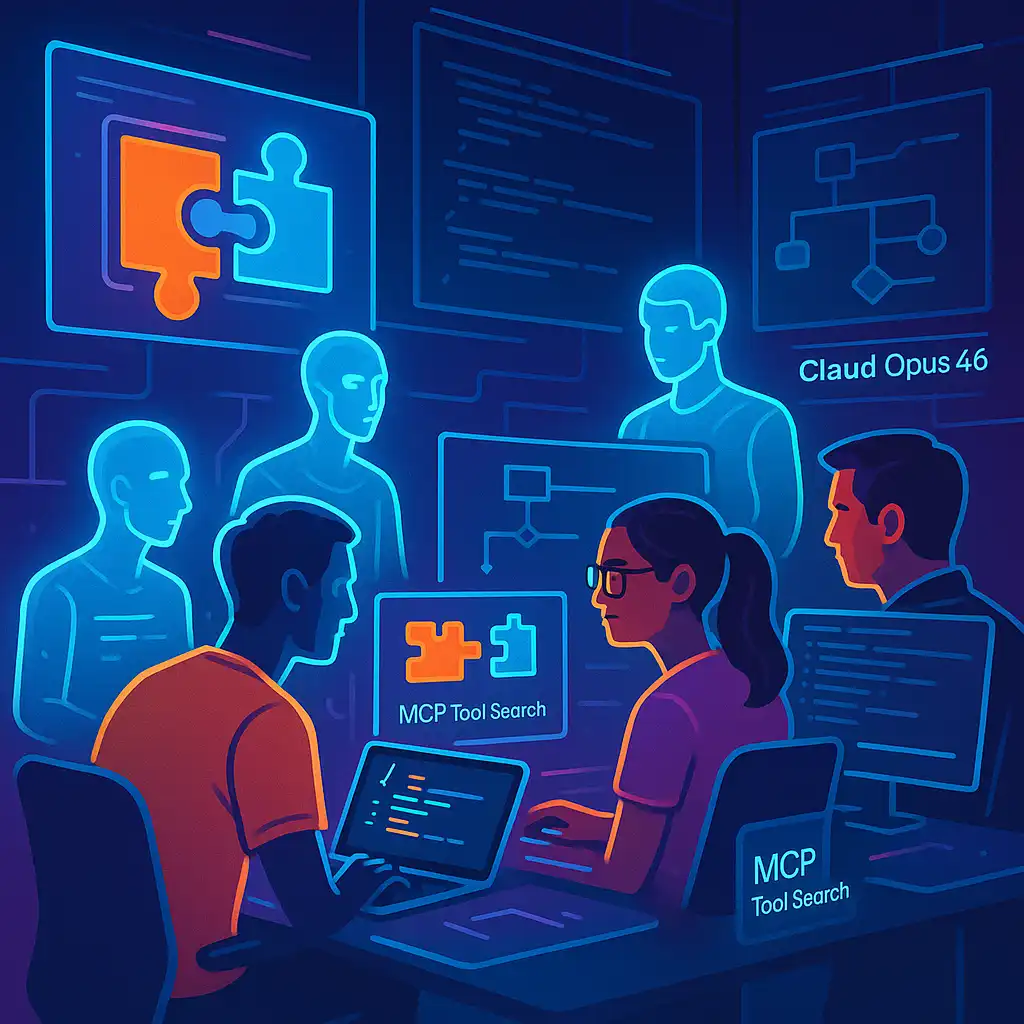
From vibecoding to agent teams: Practical playbooks for Claude Opus 4.6 and MCP Tool Search
Over the last 18 months, coding with AI has shifted from novelty to normal. With Claude Opus 4.6, Anthropic is pushing that shift further—from “vibecoding” to what they’re calling “vibe working,” where agent systems sustain longer tasks and ship production-quality outputs [4]. Opus 4.6 improves planning, code review, and debugging in large codebases, pulls relevant…
-
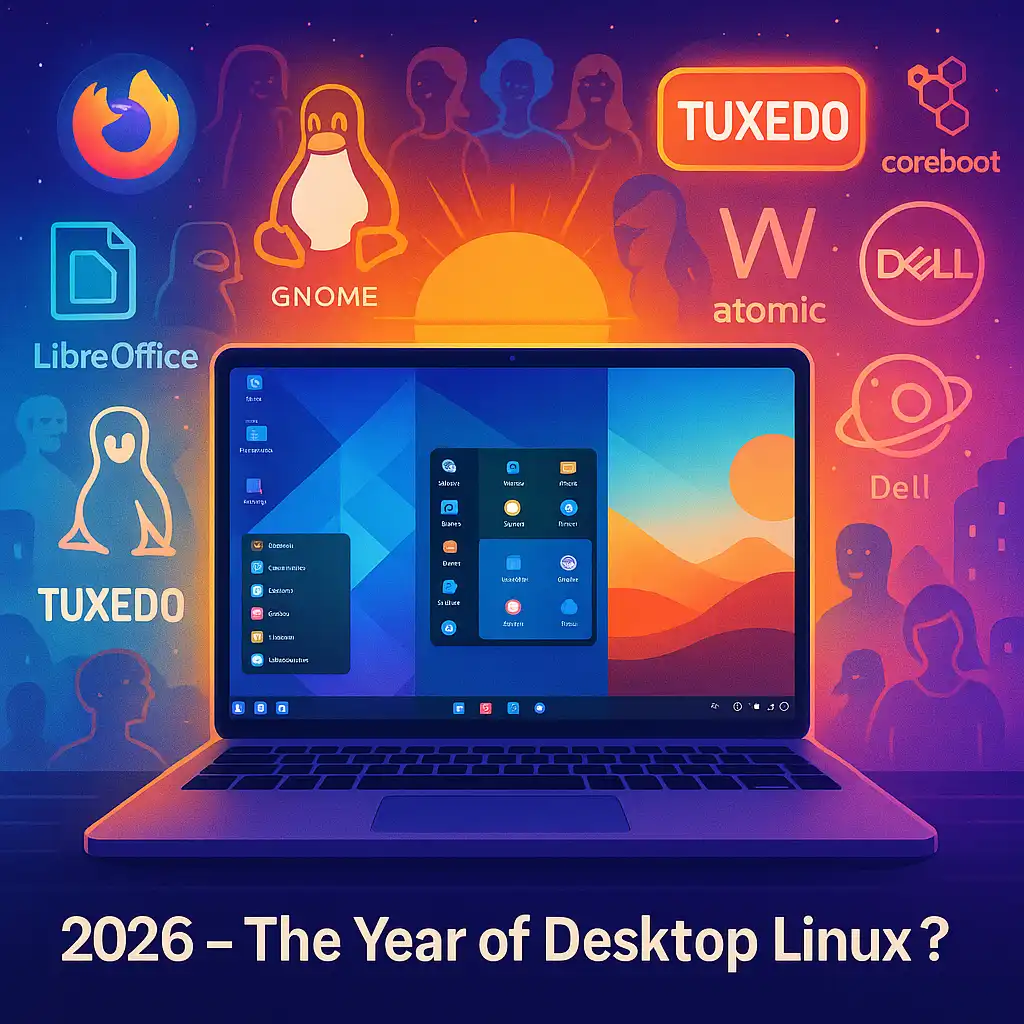
Is 2026 the Year of Desktop Linux? Unpacking the Latest Developments
For as long as I’ve been in tech, the phrase “The Year of Desktop Linux” has been bandied about more often than I care to count. Yet, as we move into 2026, something feels different. The Linux desktop landscape is seeing a burst of new energy: innovative distributions, maturing desktop environments, hardware vendors giving us…
-
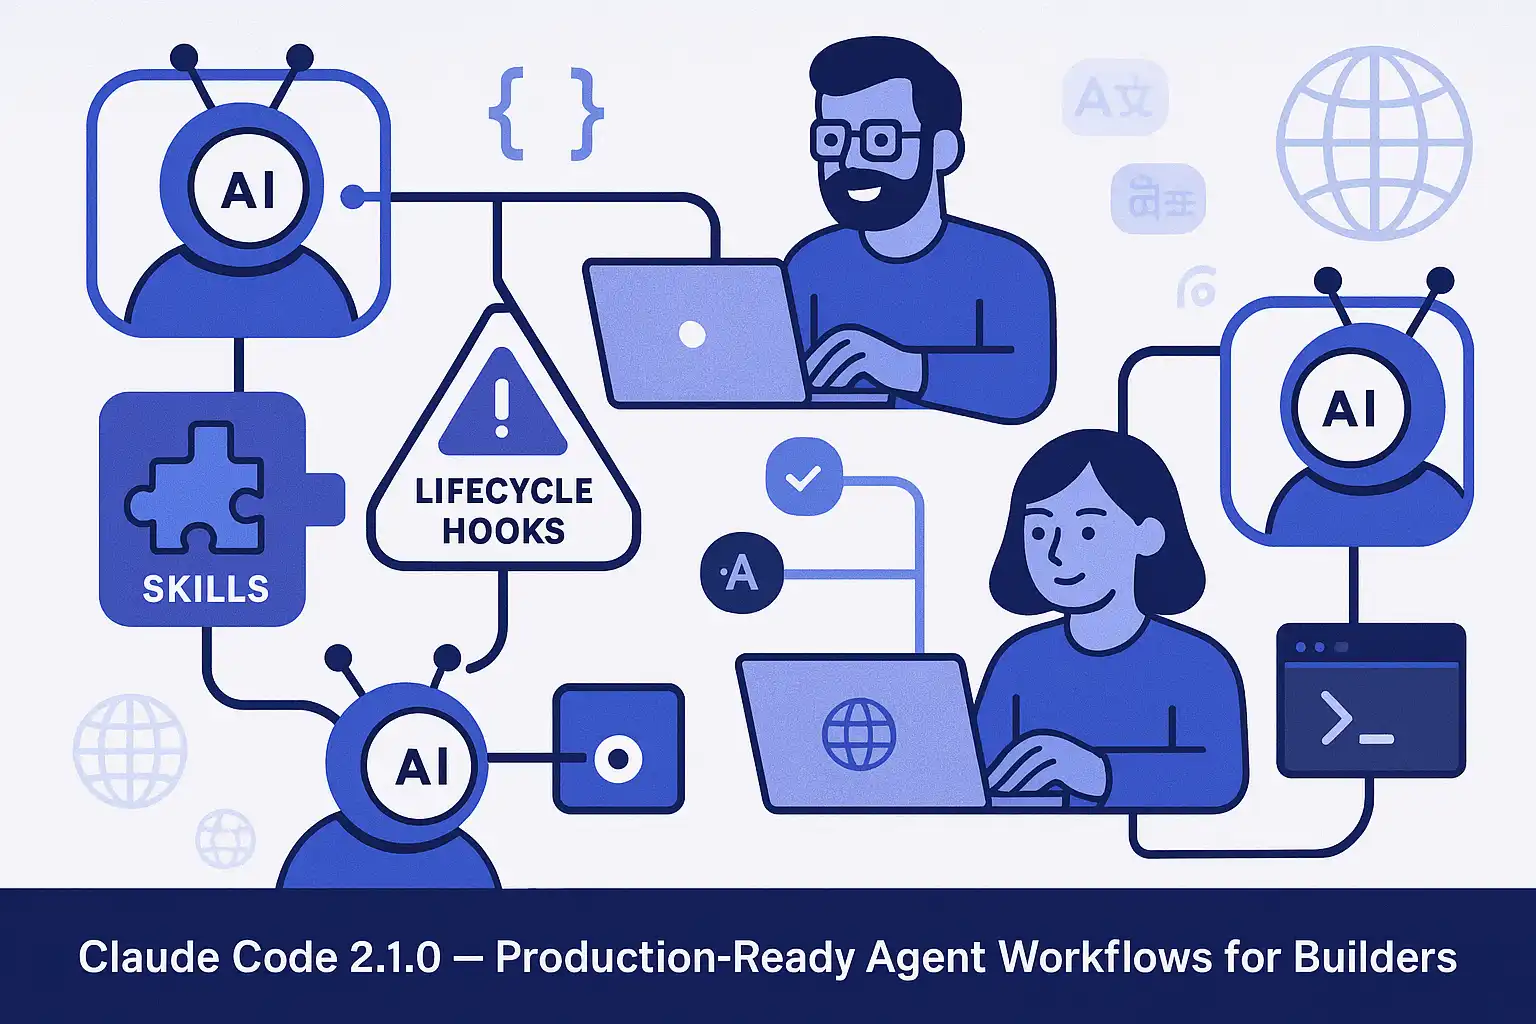
Claude Code 2.1.0 for Builders: Hooks, Skills, and Production-Ready Agent Workflows
I’ve spent the past year shipping with AI coding agents, and Claude Code 2.1.0 is the first release that truly treats “agent ops” as an engineering discipline, not a demo. Anthropic added lifecycle hooks, reusable skills, portable sessions, smarter tool permissions, and multilingual responses—features that cut the yak-shaving required to take agents from a chat…
-
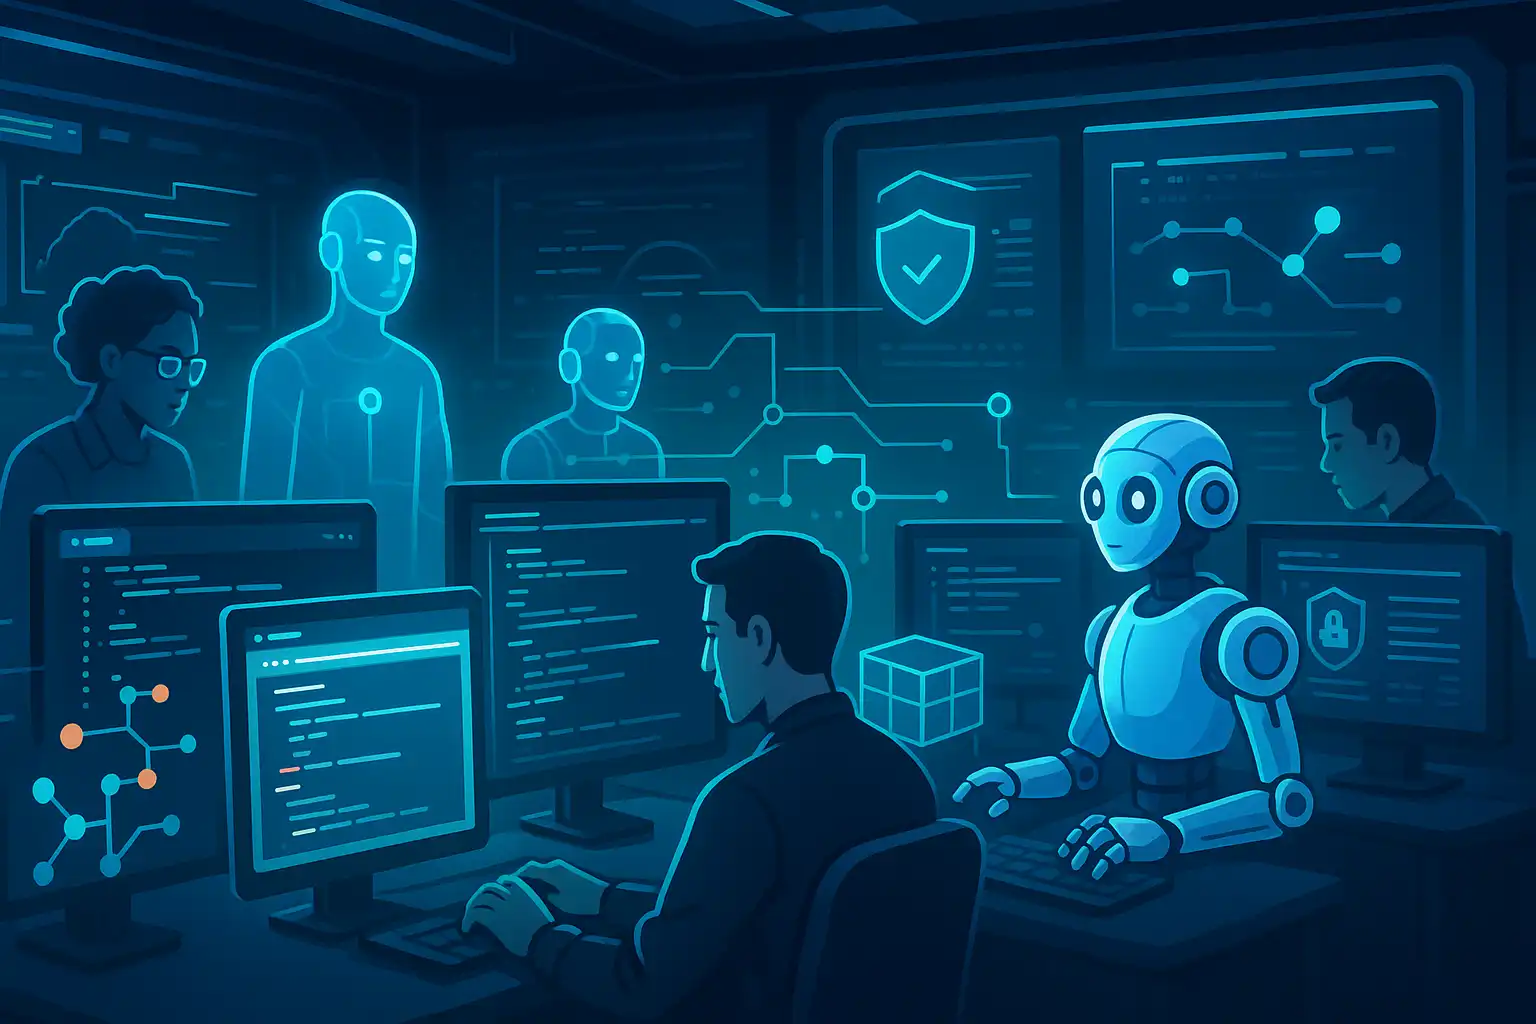
From Copilots to Crews: Building a Secure, Observable Agentic Dev Stack in 2026
AI coding agents have crossed a threshold: they’re no longer just autocomplete for code—they’re planning, executing, testing, and validating end-to-end features like a small team. Top-tier reasoning models such as GPT-5.2 and Claude Opus 4.5 are being paired with orchestration that routes “hard thinking” to expensive models and simpler work to cheaper ones, a pragmatic…
-

Agentic AI in 2026: From Hype to Real-World Impact
The rise of agentic AI—intelligent systems capable of autonomous action and multi-step problem solving—has moved rapidly from theoretical promise to practical deployment. In 2026, we are witnessing a surge in adoption across industries, transforming how organizations build software, automate workflows, and manage complex operations. What is Agentic AI? Agentic AI refers to systems that can…
-
Angular 21: The Modern Transformation Every Developer Should Know About
If you’ve been waiting for a reason to give Angular another look, Angular 21 is the game-changing upgrade developers have been hoping for. With its official release in November 2025, Angular 21 is not just an incremental bump—it’s a fundamental transformation that brings the framework squarely into the modern era. Let’s break down the biggest…
-
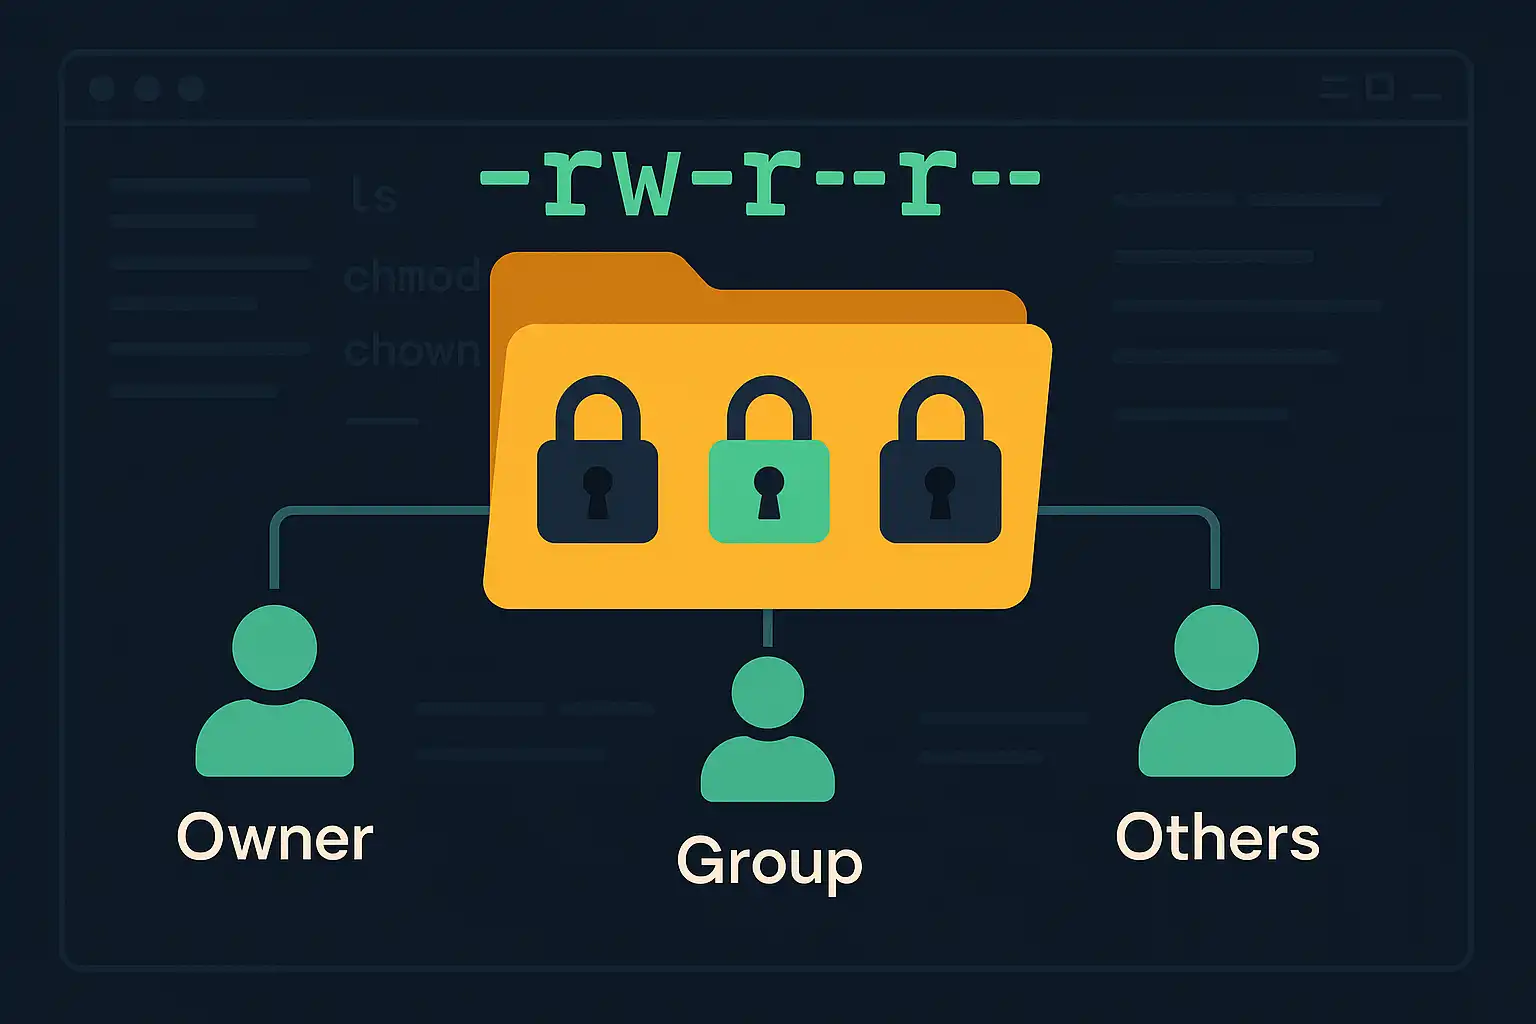
Understanding File and Directory Permissions in Linux
File and directory permissions are fundamental to maintaining a secure and organized Linux environment. Correctly setting permissions helps protect data and ensures that only authorized users access or modify specific files. In this article, we’ll explore the basics of file and directory permissions, how users and groups work, and introduce essential commands like ls, chmod,…
-
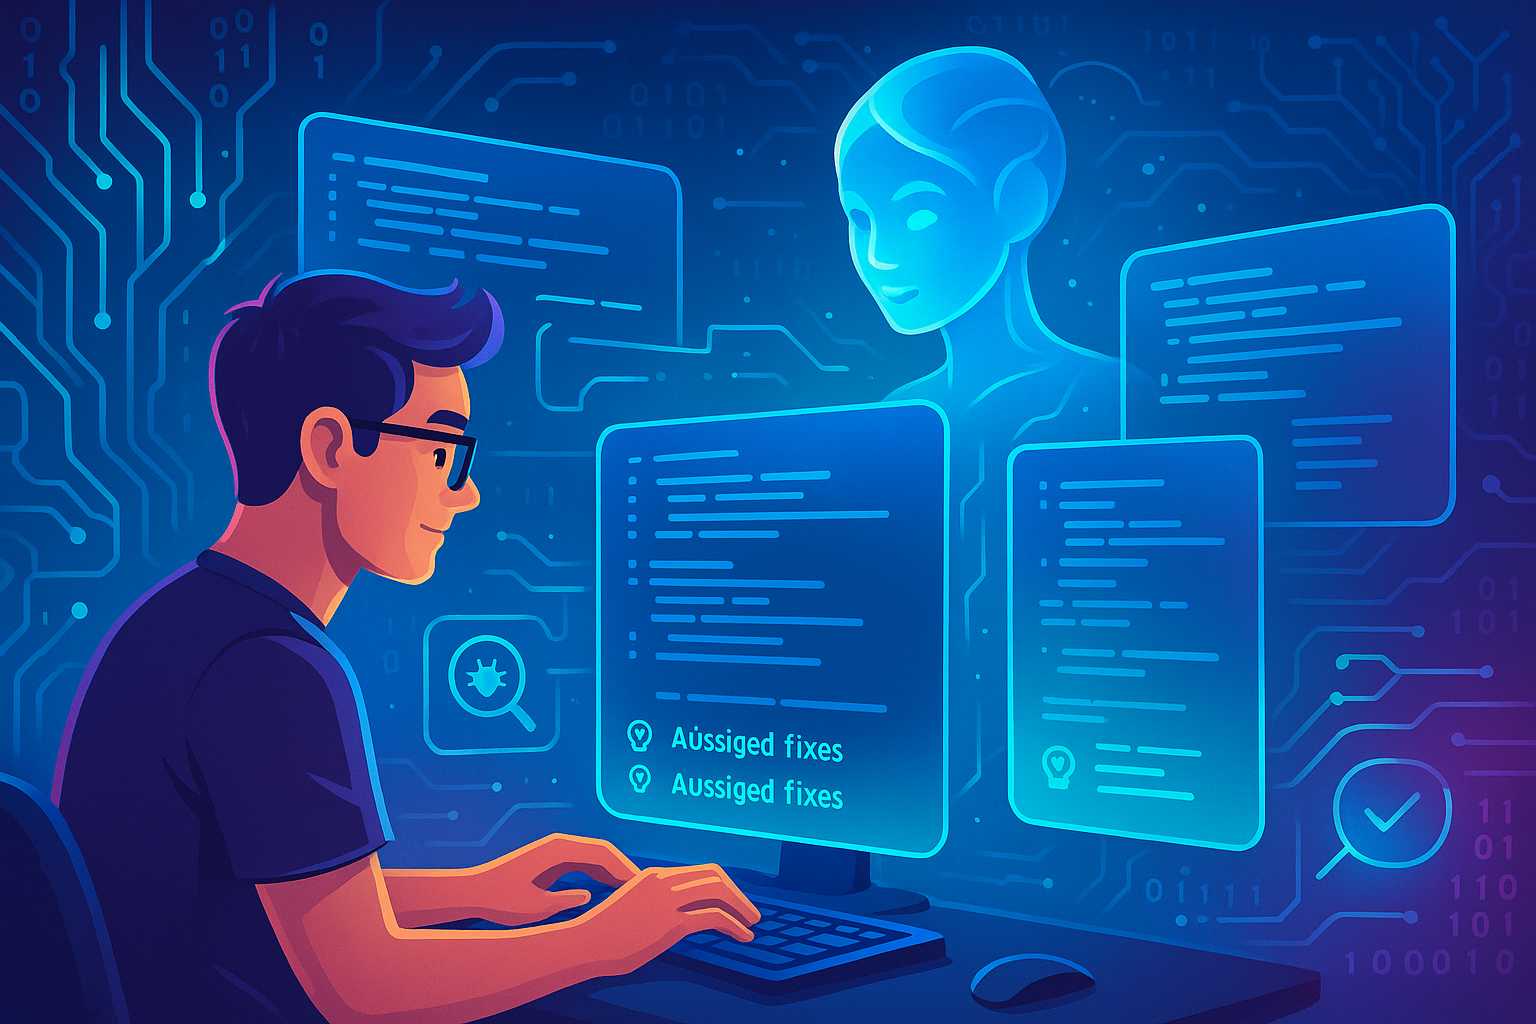
Debugging with AI Coding Agents: A New Paradigm for Problem Solving
For decades, debugging has been one of the most mentally taxing tasks in software development. Developers sift through logs, insert breakpoints, and attempt to reproduce subtle bugs. But the landscape is changing rapidly with the advent of AI coding agents—advanced systems that can help track down, explain, and even fix code defects. In this article,…
-
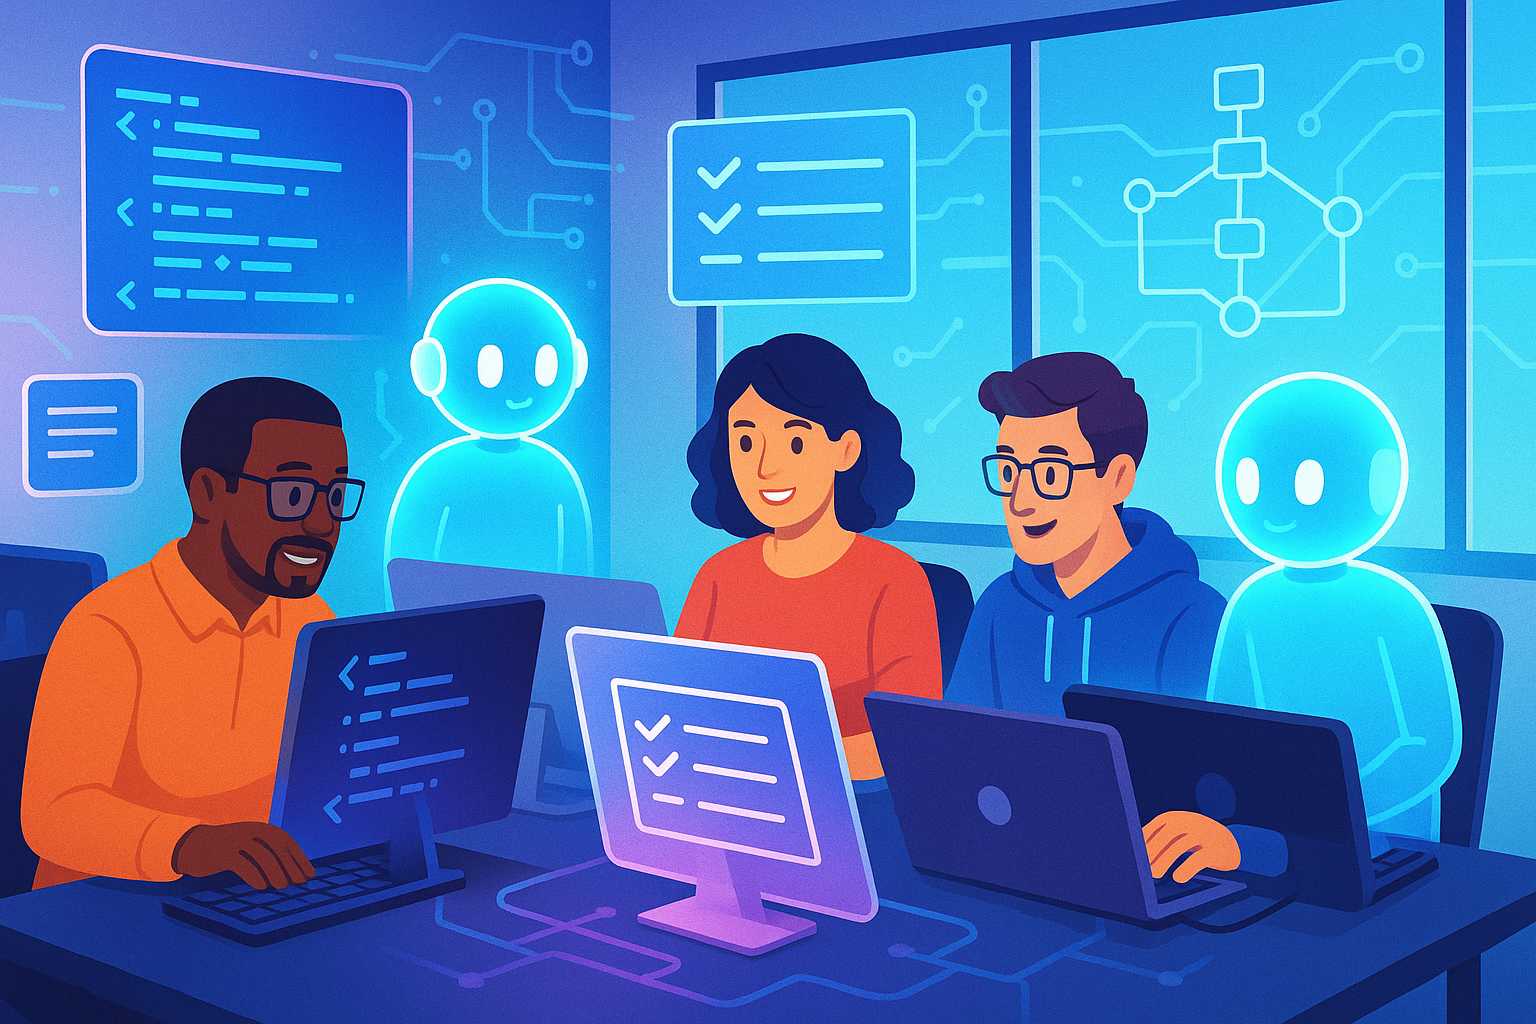
Collaborative Coding with AI Agents: Strengthening Team Workflows
AI coding agents are rapidly transforming solo development, but their benefits are even more pronounced in collaborative environments. In this article, we’ll explore practical strategies for teams to leverage AI agents, from code review assistance to enhanced documentation and streamlined handoffs. AI-Powered Code Review Assistance Traditional code reviews can be a bottleneck, especially in distributed…
-
Prompt Engineering for AI Coding Agents: Best Practices and Pitfalls
As AI coding agents become ubiquitous tools in modern software development, the way developers interact with them is undergoing a quiet revolution. No longer are we simply writing code—now, we craft prompts: concise, context-rich instructions that steer AI agents toward our desired outcomes. In this article, I’ll share best practices and common pitfalls for prompt…