
Tag: CLI
-

Supercharging Linux Development with AI Coding Agents
Over the past year, AI coding agents have become essential companions for developers looking to streamline their workflow, boost productivity, and minimize errors—especially in Linux environments. As someone experienced in integrating these agents into various stages of the software development lifecycle, I’m excited to share how they’re specifically transforming day-to-day Linux development. Why Linux? Linux…
-
Integrating AI Coding Agents into Continuous Integration Pipelines
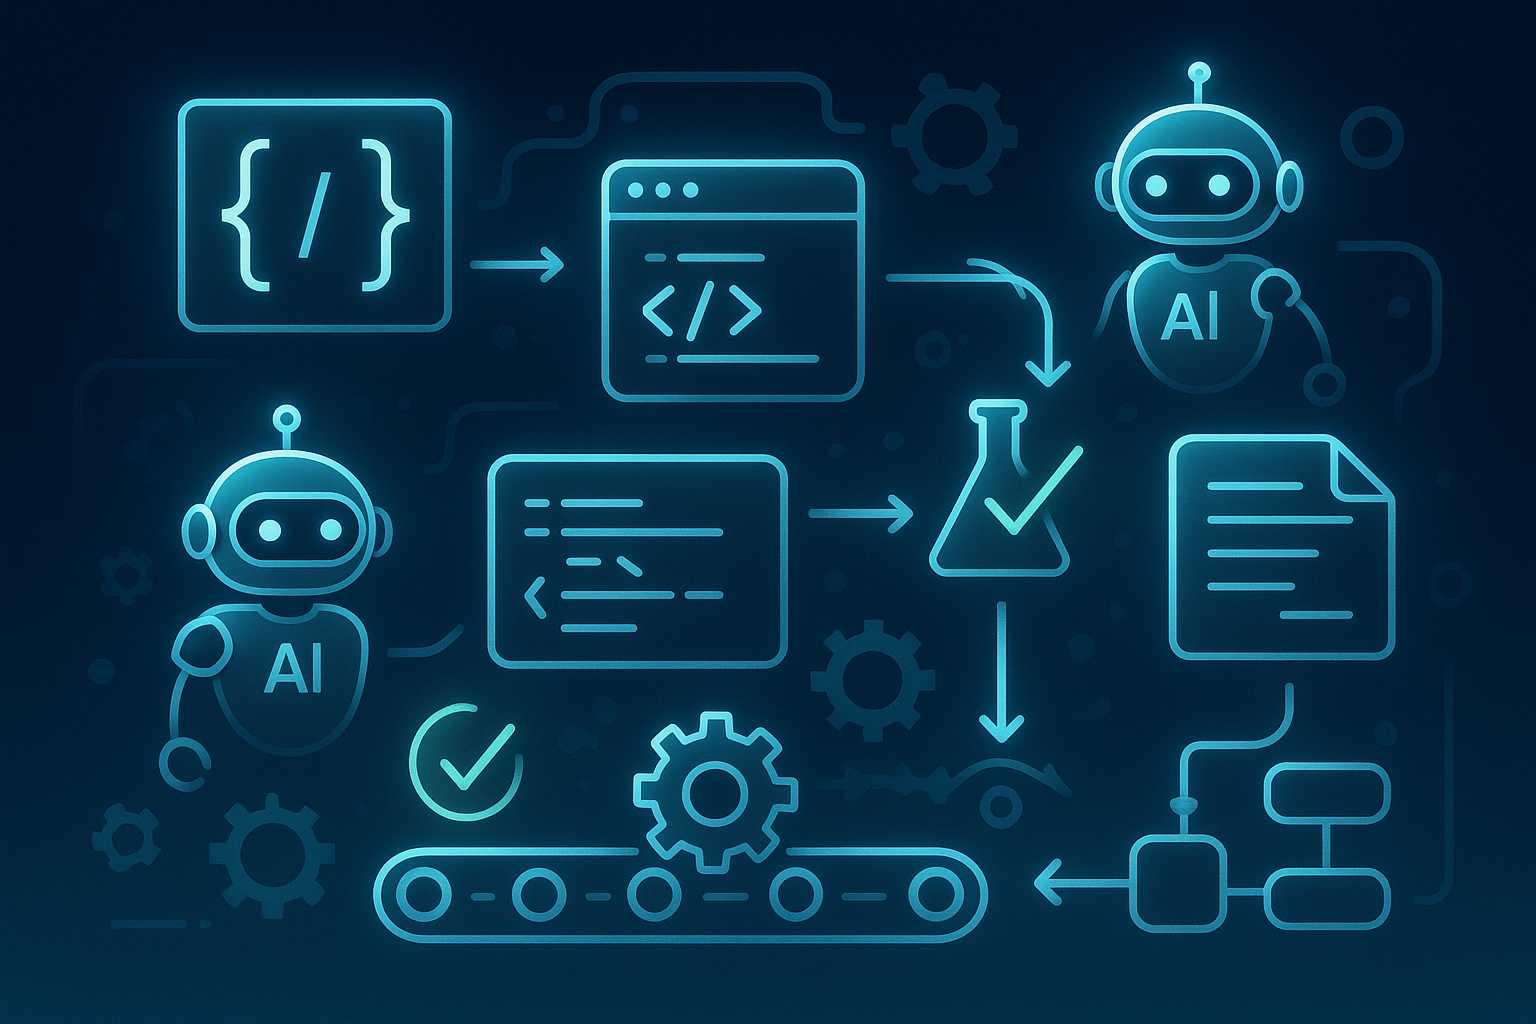
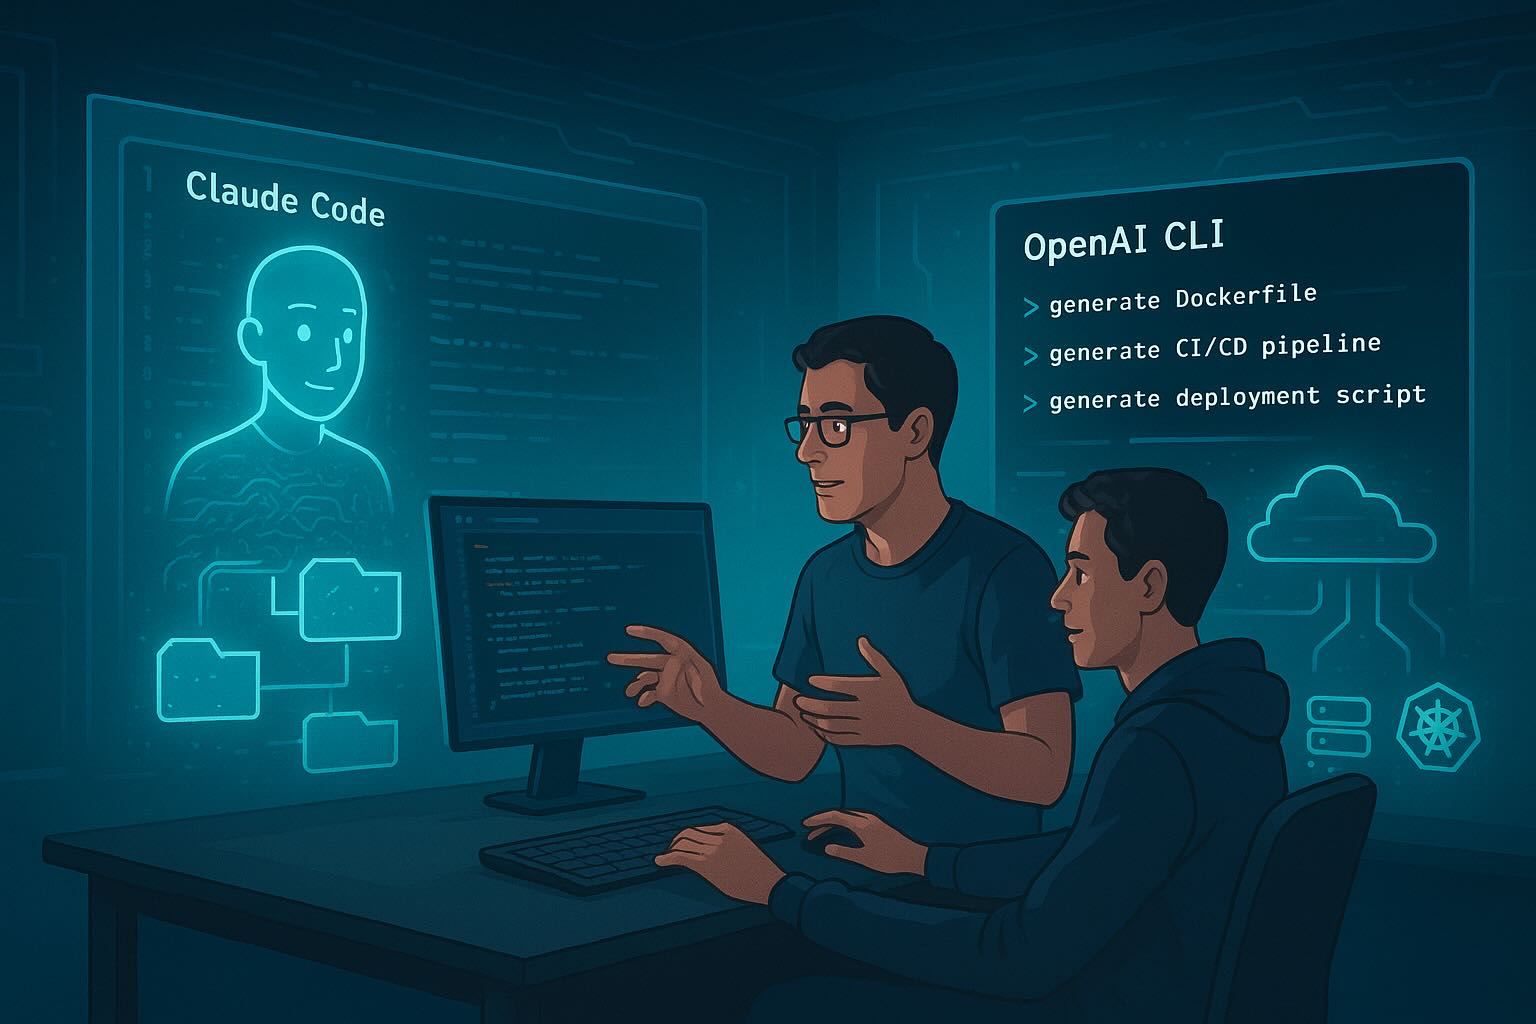
Introduction With the rise of AI coding agents like Claude Code and OpenAI Codex CLI, developers are no longer limited to traditional tools for writing, reviewing, and testing code. One of the most promising frontiers is the integration of these agents directly into continuous integration (CI) pipelines. This article explores the benefits, challenges, and practical…
-
Managing Apache Service Logs from the Command Line
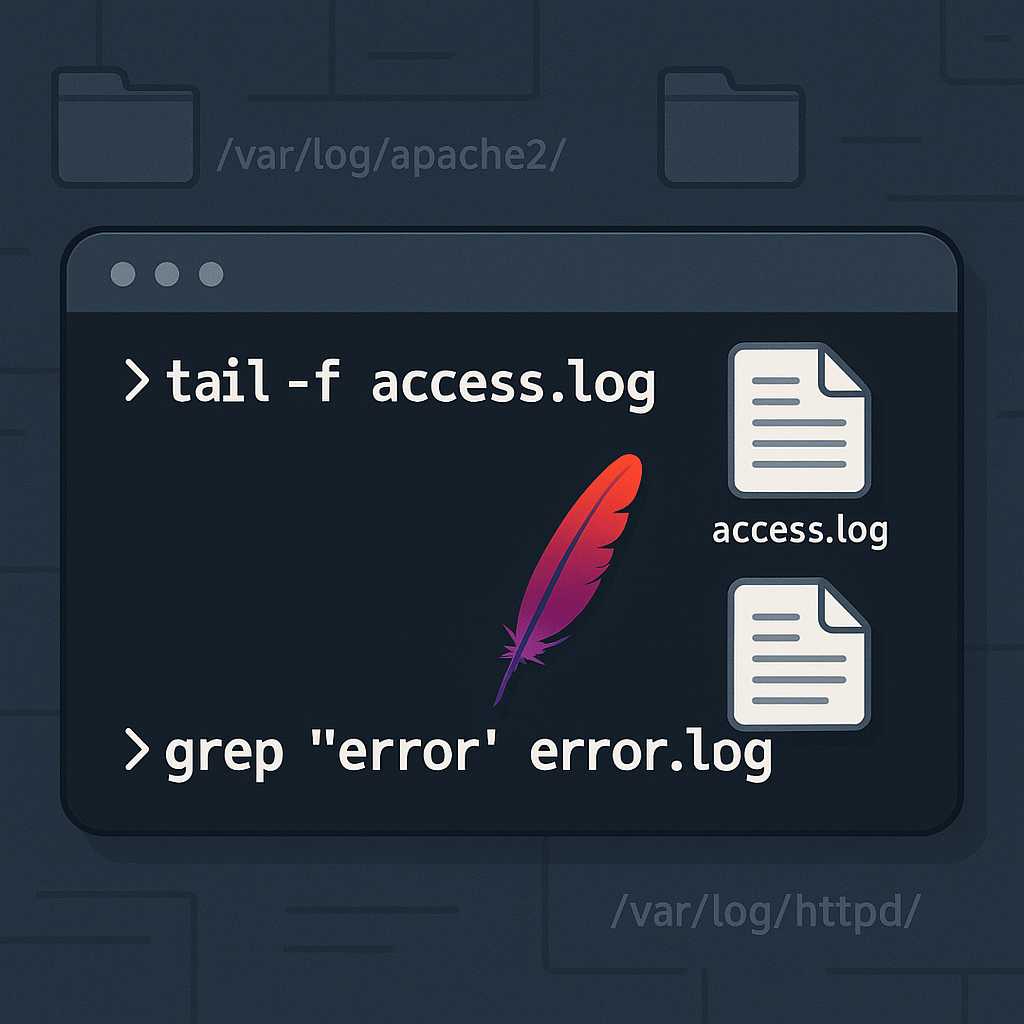
If you’re running web services on a Linux server, monitoring Apache’s logs is essential for troubleshooting and performance tuning. Apache, by default, generates two primary log files: the access log and the error log. In this article, I’ll show you my favorite command-line ways to view, tail, search, and archive Apache logs, all from your…
-
Level Up Your Command Line: Creating Custom Python Scripts with argparse
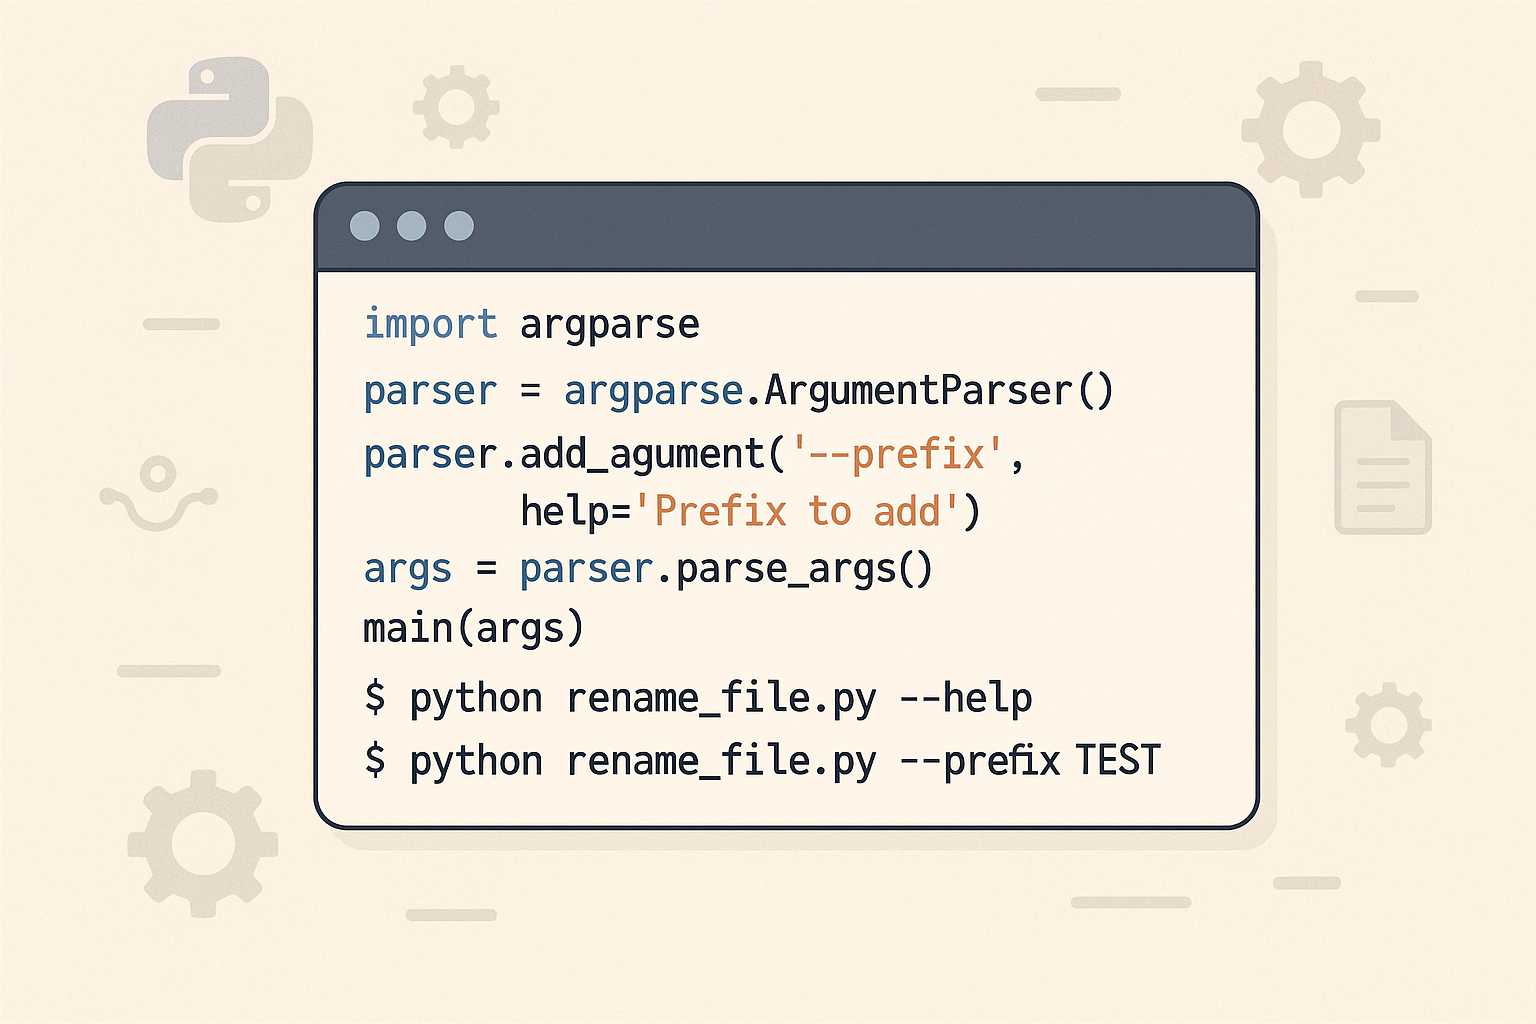
If you’ve ever found yourself running repetitive tasks in the terminal or wanted more control over how you launch Python scripts, it’s time to meet a powerful ally: the argparse module. This standard library tool unlocks the ability to build rich, user-friendly command-line interfaces (CLIs) for your Python projects—no external dependencies required! Why argparse? While…
-
Troubleshooting Apache Startup Failures from the Command Line
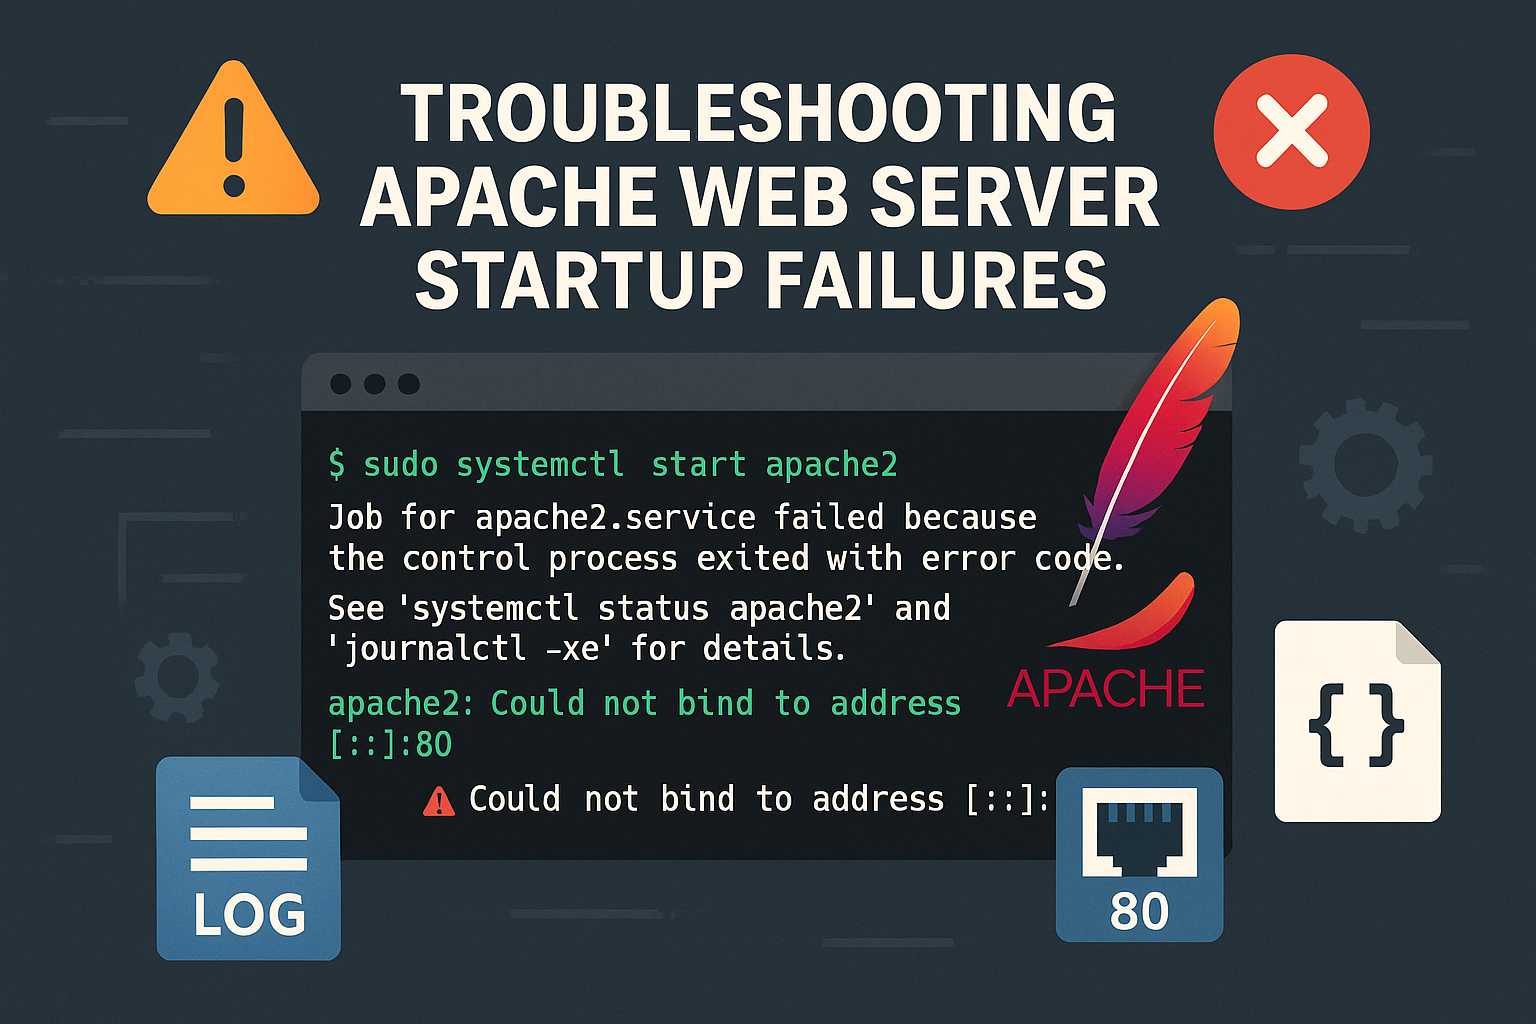
When you’re running a Linux server hosting web sites with Apache, seeing the dreaded “Failed to start Apache” error can be nerve-wracking, especially if you’re unsure where to begin troubleshooting. In this article, I’ll walk through a systematic way to debug and resolve Apache startup issues using only the command line. 1. Check the Status…
-

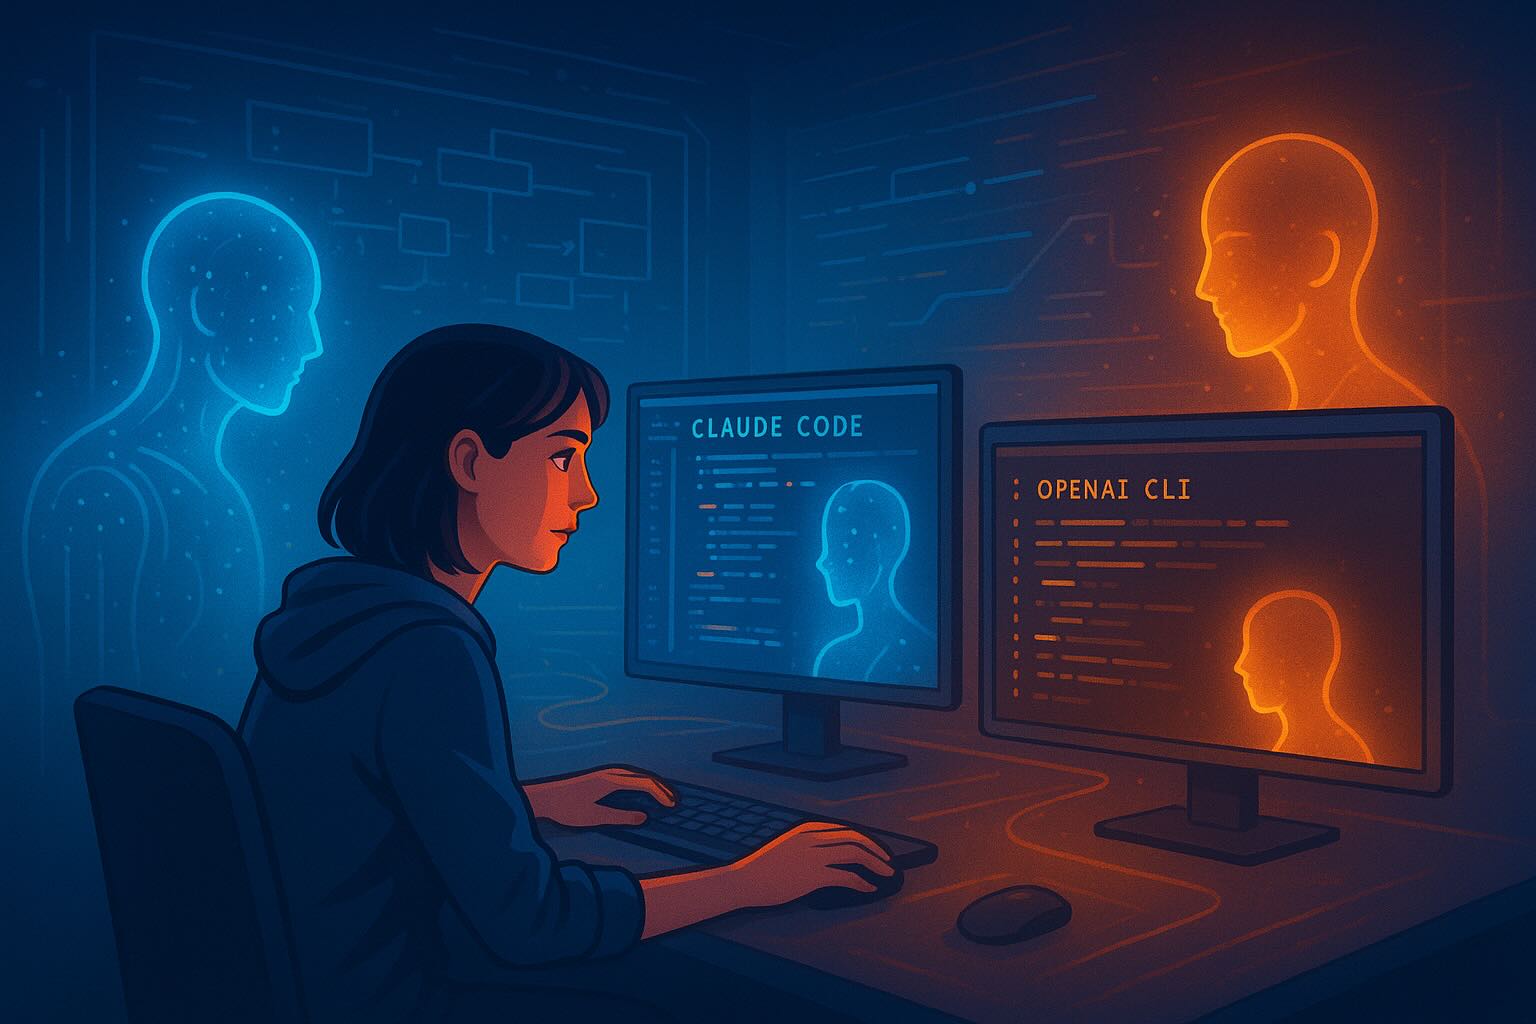
Claude Code vs. OpenAI Codex CLI: A Technical Comparison of the Newest AI Developer Agents
The rise of AI developer agents has shifted from novelty to necessity. What started as autocomplete tools has evolved into full-fledged teammates that can refactor codebases, review pull requests, run tests, and even manage development workflows end-to-end. Two of the leading contenders in this space are Claude Code (powered by Claude’s newer models) and OpenAI Codex CLI (now using GPT-5-Codex).…
-
Coding Agents in Action: A Deeper Look at Claude Code and OpenAI CLI
Follow-up to “From Vibe Coding to Coding Agents” In our last article, we explored how coding agents like Claude Code and OpenAI CLI are reshaping software development. We argued that what some call “vibe coding” is really the early stage of a much larger shift: agent-assisted development. Now, let’s go a step further. How do these tools actually fit into a developer’s…
-
From “Vibe Coding” to Coding Agents: How AI is Reshaping Software Development
For decades, software engineering has been guided by structured methodologies: waterfall, agile, DevOps pipelines. Each new era brought tools designed to reduce complexity, improve collaboration, and ship faster. But we may now be entering a deeper shift — one that changes the very nature of programming. The rise of AI coding agents is redefining how developers interact with code.…
-
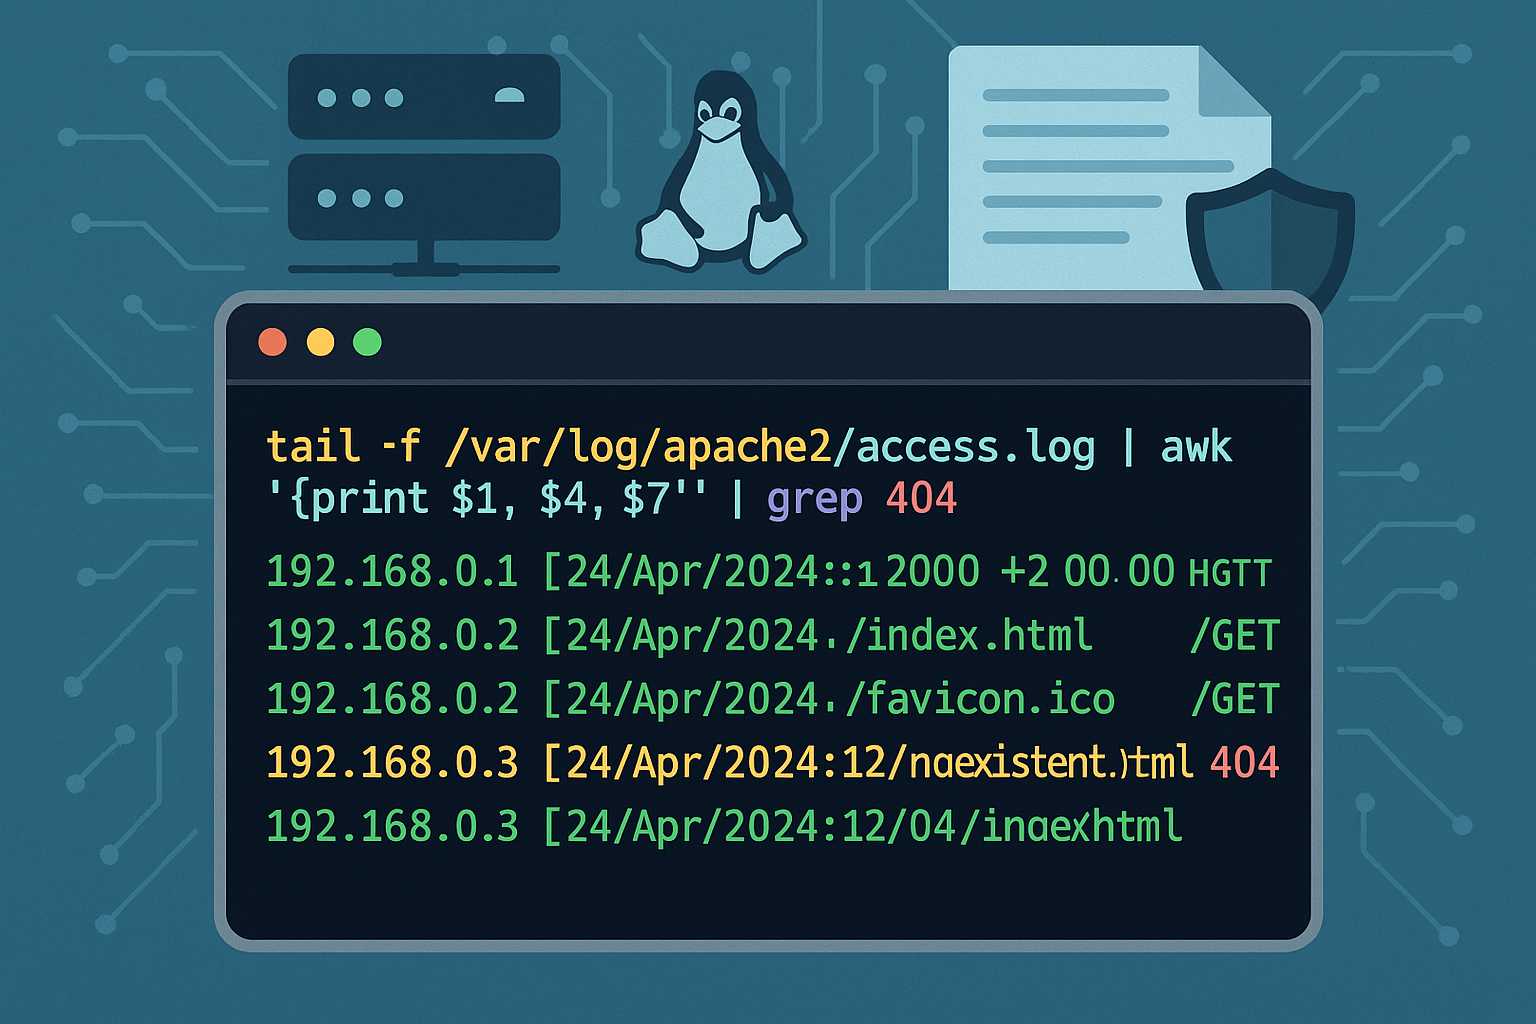
Understanding Apache’s Access Log: Command-Line Tips for Monitoring Traffic
When running an Apache web server, one of your most important tools for monitoring and troubleshooting is the access log. The Apache access log provides a granular record of every client request your web server handles, including the request method, path, HTTP status code, user agent, and more. In this article, I’ll show you how…
-

The New Era of AI-Assisted Software Development
Software development is undergoing a significant transformation with the emergence of AI coding assistants like Claude, GitHub Copilot, Devin, and others powered by models such as Codex. These tools promise to revolutionize how developers write code, but they also bring unique challenges. This article explores the potential and limitations of AI-assisted development and how it’s…