
Tag: Linux/Unix
-

Is 2026 the Year of Desktop Linux? Unpacking the Latest Developments
For as long as I’ve been in tech, the phrase “The Year of Desktop Linux” has been bandied about more often than I care to count. Yet, as we move into 2026, something feels different. The Linux desktop landscape is seeing a burst of new energy: innovative distributions, maturing desktop environments, hardware vendors giving us…
-
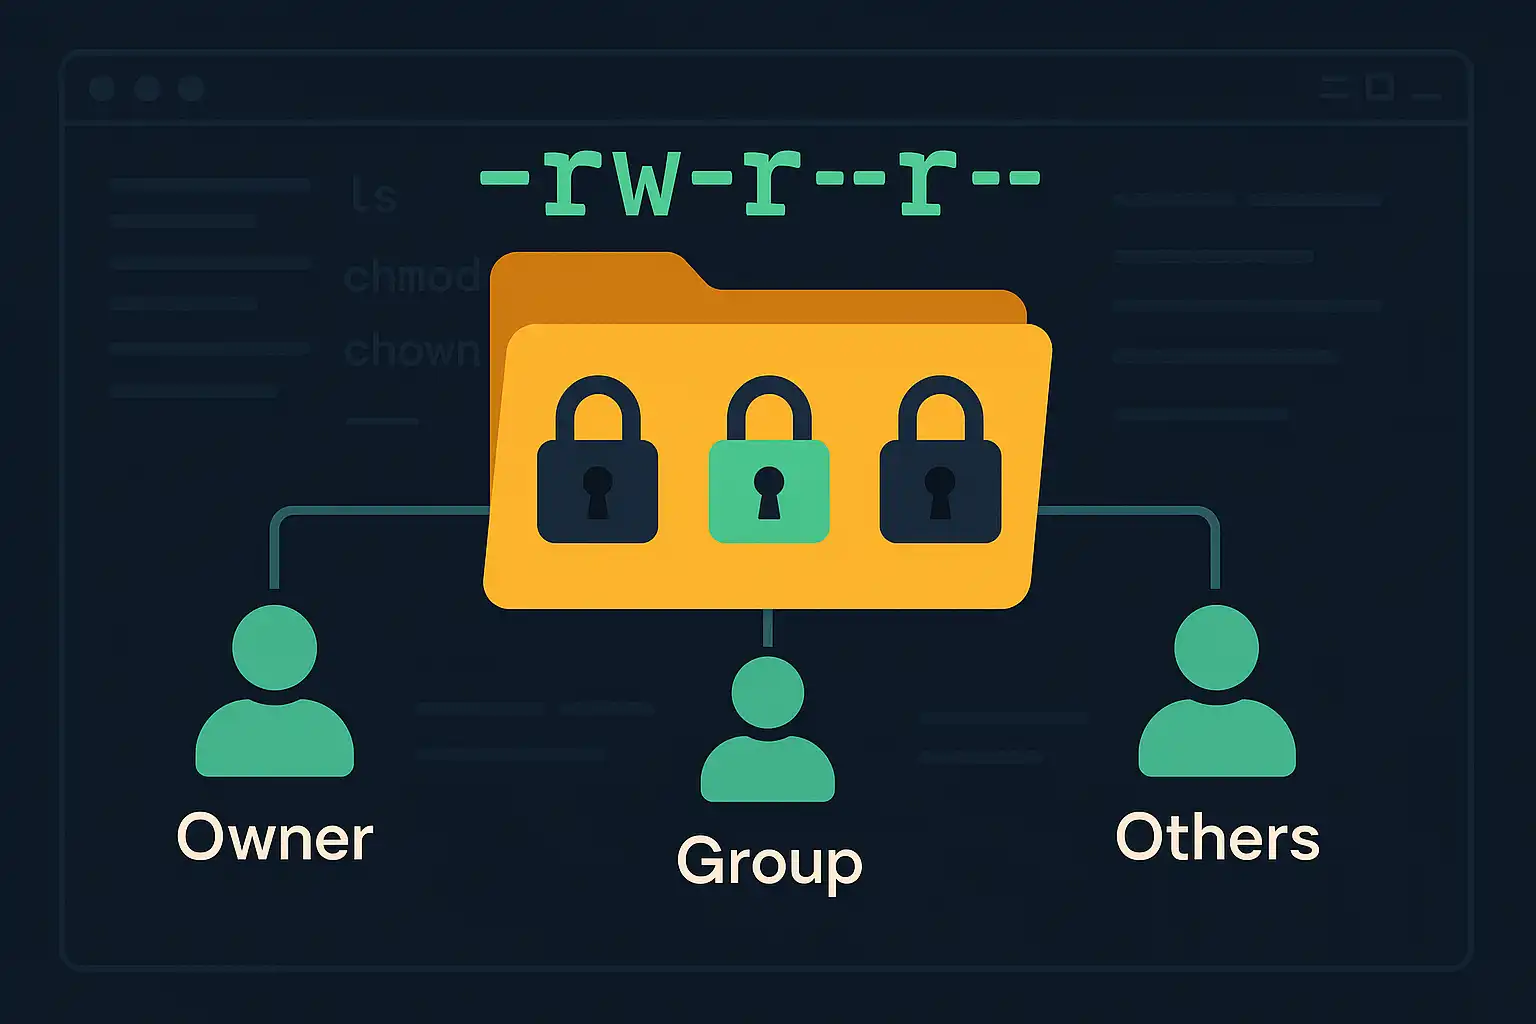
Understanding File and Directory Permissions in Linux
File and directory permissions are fundamental to maintaining a secure and organized Linux environment. Correctly setting permissions helps protect data and ensures that only authorized users access or modify specific files. In this article, we’ll explore the basics of file and directory permissions, how users and groups work, and introduce essential commands like ls, chmod,…
-

Supercharging Linux Development with AI Coding Agents
Over the past year, AI coding agents have become essential companions for developers looking to streamline their workflow, boost productivity, and minimize errors—especially in Linux environments. As someone experienced in integrating these agents into various stages of the software development lifecycle, I’m excited to share how they’re specifically transforming day-to-day Linux development. Why Linux? Linux…
-
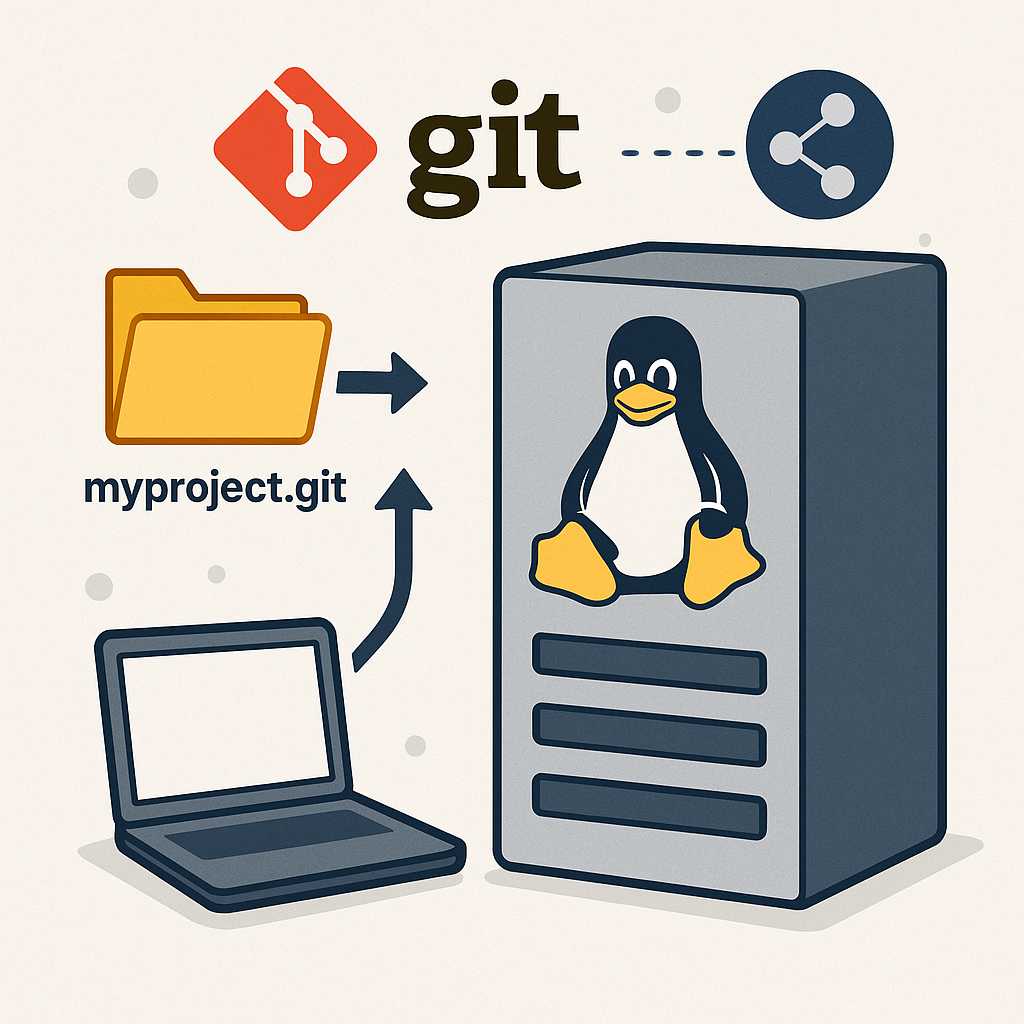
How to Create and Use a Bare Git Repository on a Linux Server
Setting up a bare Git repository on a Linux server is a foundational skill for teams that want to collaborate using a centralized remote repository. A bare repository is essentially a Git repository without a working directory, designed to be a central point for collaboration rather than for editing code directly. In this article, you’ll…
-
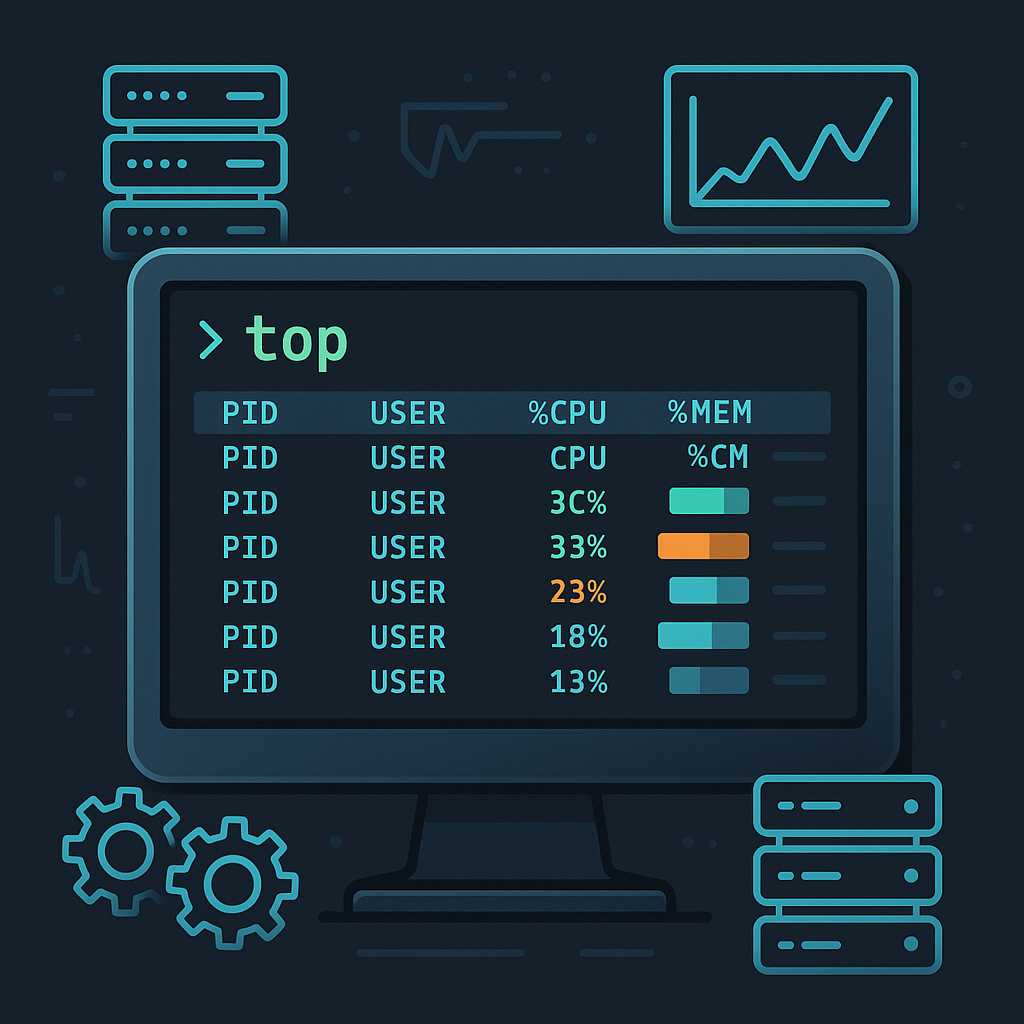
Mastering the ‘top’ Command: Tips for Efficient Linux Server Monitoring
When it comes to monitoring the health and performance of your Linux servers, the "top" command is often one of the first tools in an administrator’s arsenal. It provides a real-time, dynamic view of what’s happening on your system, including which processes are consuming the most resources and overall system load. Yet, many users only…